The Set-Up
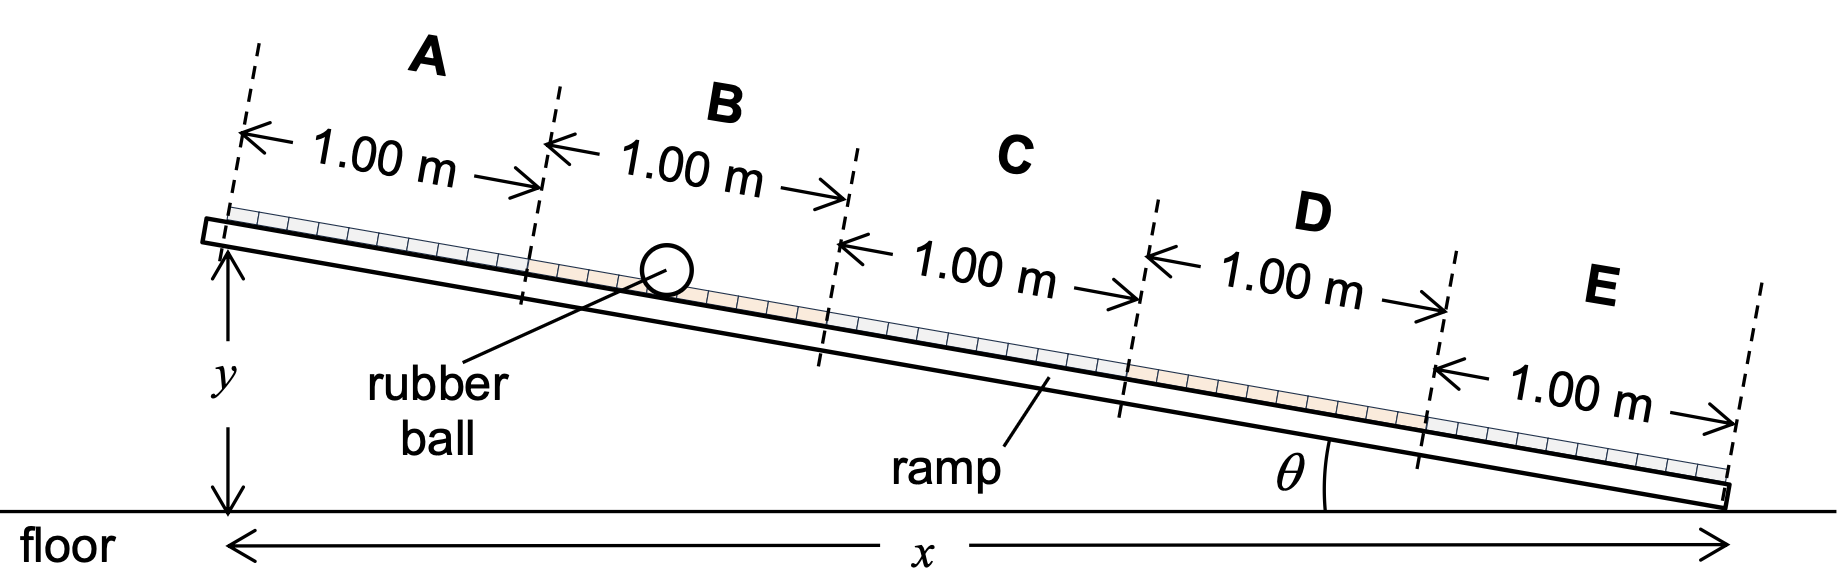
Ramp Motion Analysis
Enter time (in seconds) for each 1 m section:
Average Speeds Table
| section | time (s) | average speed (m/s) | midpoint time (s) |
|---|
Distance–Time Graph
Velocity–Time Graph
Acceleration–Time Graph
Understanding The Graphs
The key to understanding how these graphs were calculated is to realise that when we are determining the average speeds for each section that will be the speed that the ball has at the mid-point (in terms of time).
Also each metre is traversed in a shorter time than the previous metre as the ball is constantly accelerating.
This can clearly be seen if we shade the graph for each one-metre length – we will get something like this:
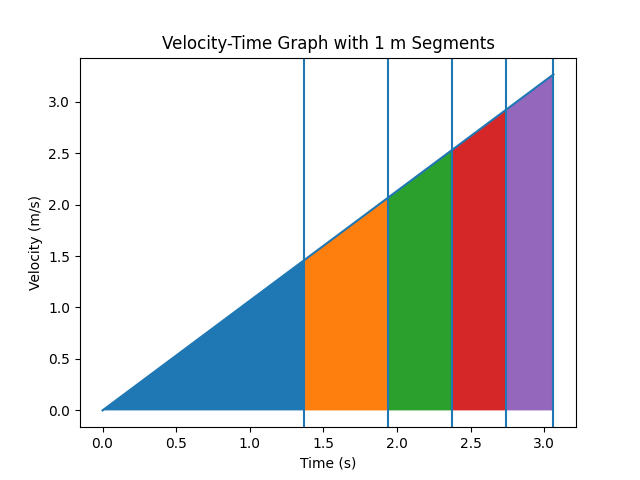
Each of the shaded areas has the same area representing the same distance travelled (i.e. one metre).