An “LOL Chart” is a pair of bar graphs that shows how energy is changing in a system.
It’s called “LOL Chart” because the chart outline looks like LOL letters.
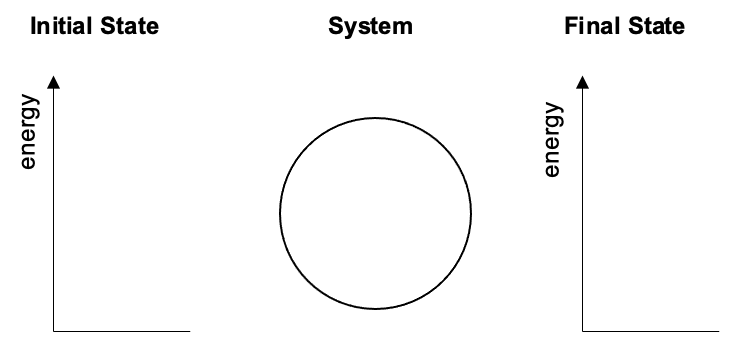
It’s a way to visualise the energy in the system and help with energy calculations.
The objects that we are considering are stated in the system “O”.
There are eight different types of energy stores:
-
- kinetic store
- gravitational potential store
- elastic potential store
- chemical potential store
- nuclear store
- internal (thermal) store
- electrostatic store
- magnetic store
Energy can be transferred from one energy store to another in four different pathways:
-
- mechanically by force acting over a distance
- by heating due to a temperature difference
- by propagation of waves (electromagnet waves and mechanical waves)
- by electric current (by charges moving through a potential difference)
| Example |
|---|
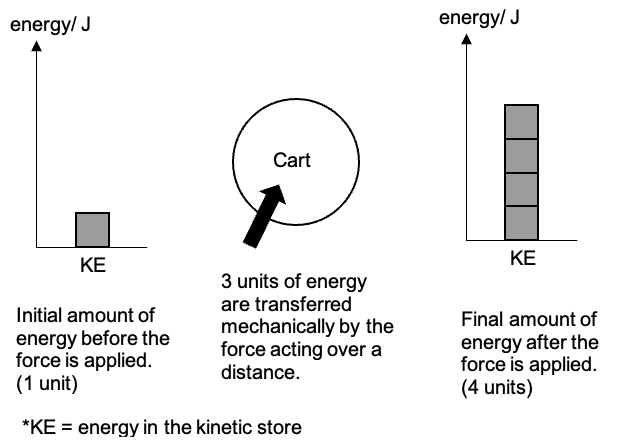
| A cart that is pushed by a constant force moves horizontally over a distance at increasing speed. The force transferred energy to the cart mechanically and caused the cart to increase its energy in the kinetic store and speed.
The LOL diagram for this question would take the following form:
|
| << Back | Work, Energy, Power & Efficiency | Next >> |