Sound waves are often shown as neighbouring layers of air rather than just individual air molecules. In the following diagrams each line can be thought of as a layer of air molecules.
| Caution |
|---|
| Do not confuse these “layers” with the wavefronts.
Wavefronts in diagrams only show successive instances of one part of the wave – eg each crest. |
Sound waves can be represented by displacement-time, displacement-position and pressure-position graphs.
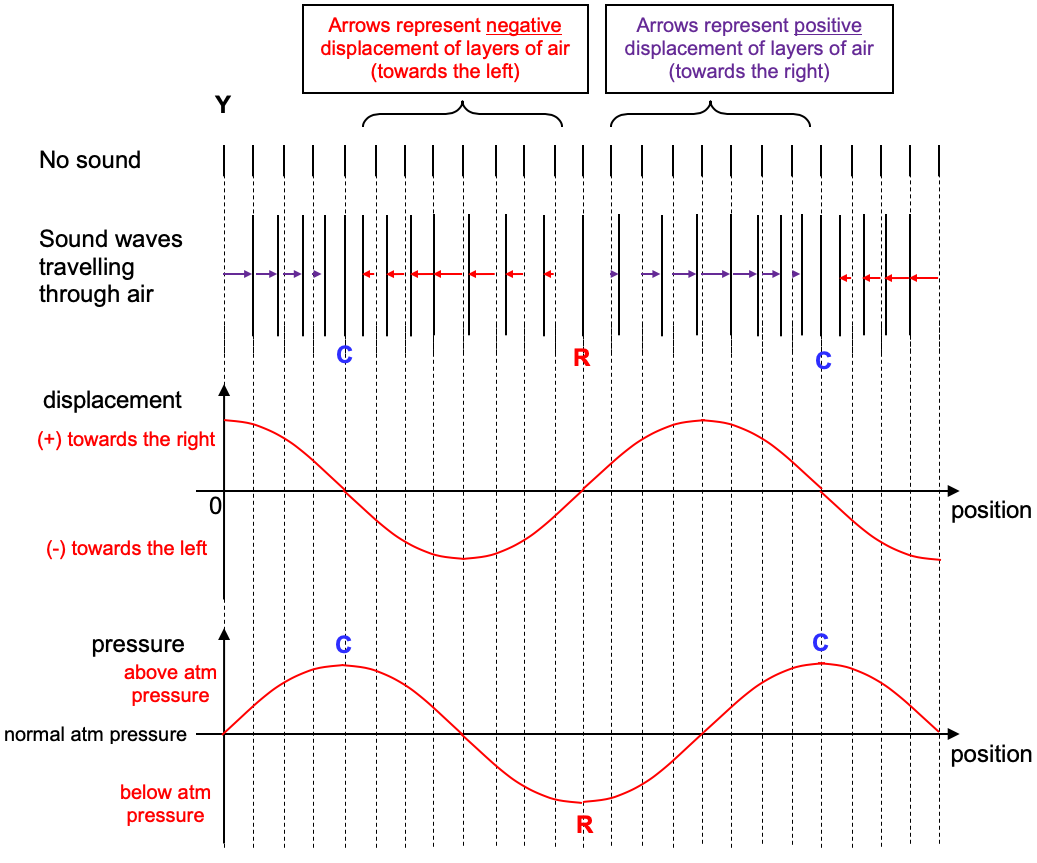
Considering the layer Y, over time it will have the following displacement-time graph:

In more detail:
With no sound wave moving through the air, the layers of air will be equally spaced (the grey lines).
With a sound wave passing through the air, the layers of air will vibrate about their mean position. i.e will vibrate about where they would be if there were no sound wave (they grey dotted lines).
 layers of air with no sound (top) and sound waves passing (lower)
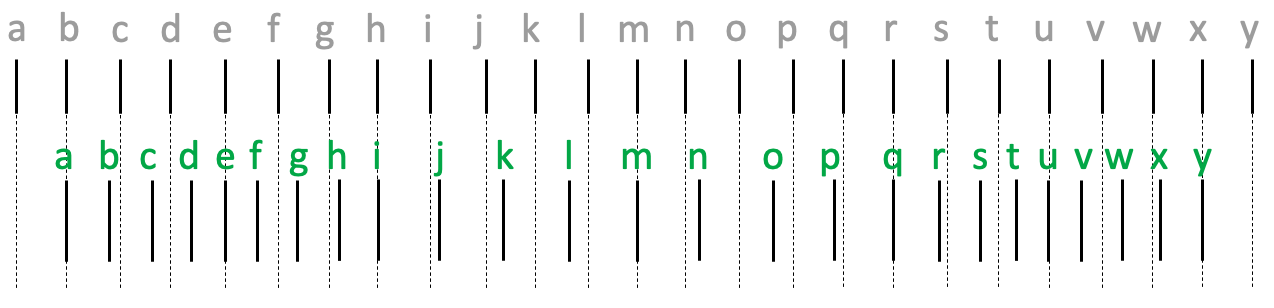
The green letters show the possible positions of the layers a–y as a sound wave passes.
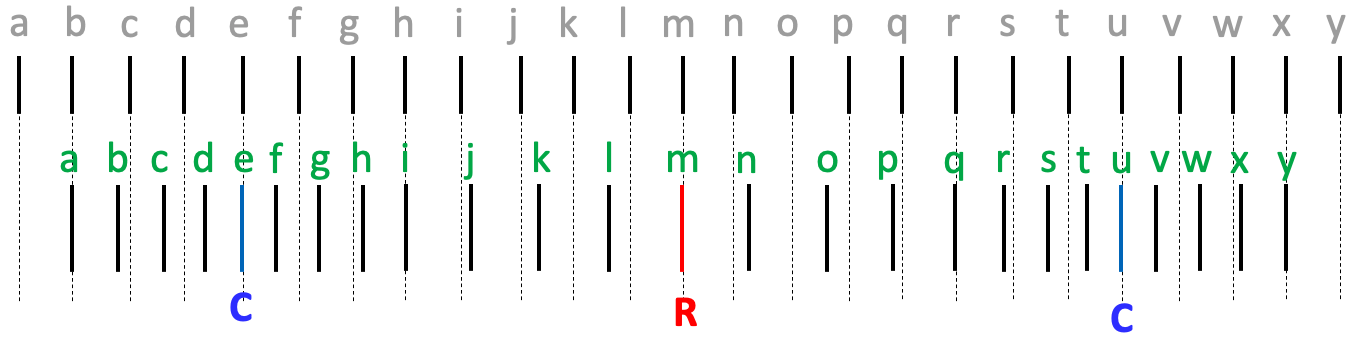 showing compressions & rarefactions
The compressions and rarefactions can easily be identified from this diagram. Layers e and u are at the centres of compressions, whilst m is at the centre of a rarefaction.
Notice that e, m and u (both compressions and rarefactions) layers are located at their mean positions.
Other layers will, however, be displaced from their mean positions.
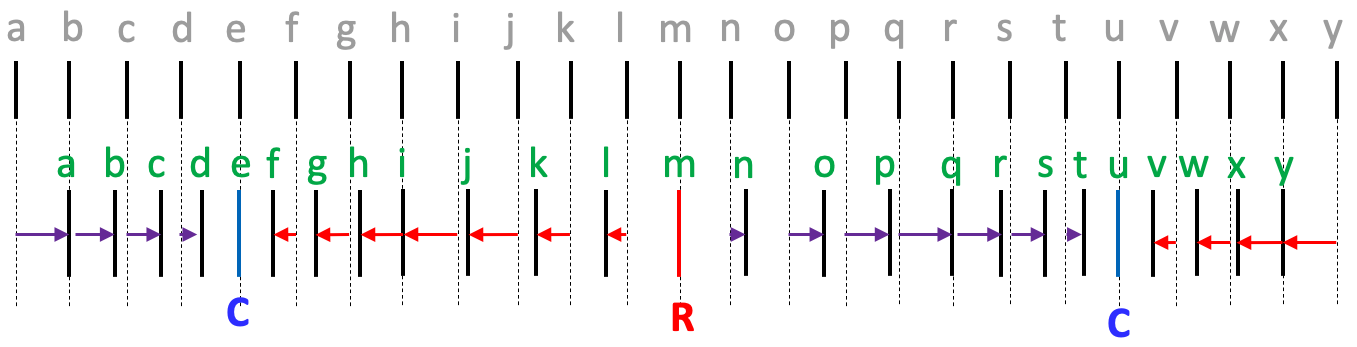 displacement of each layer
Here we see the displacement of different particles. Some (red arrows) are displaced to their left, and some (blue arrows) to their right.
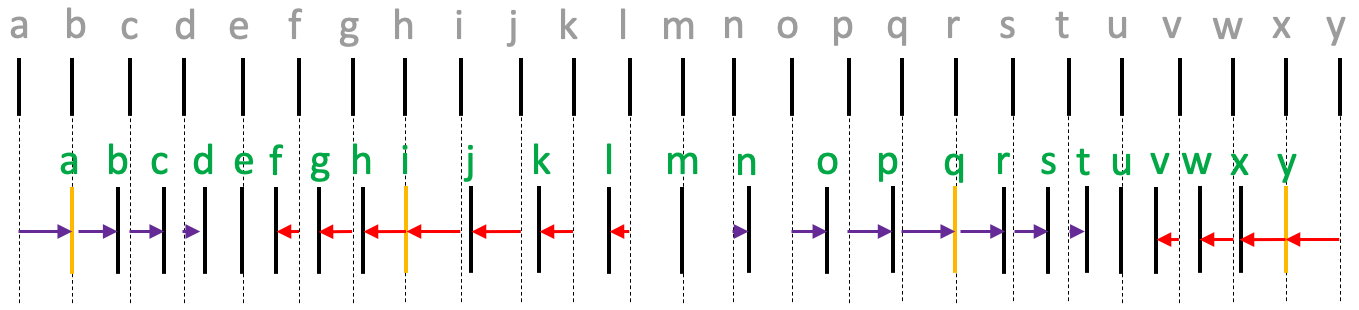 particles having maximum displacement (thus stationary)
Notice how layers a, i, q and y are all at maximum displacement from their equilibrium positions. This means that they are not moving and are about to change direction, having just been moving in one direction and now about to move in the other.
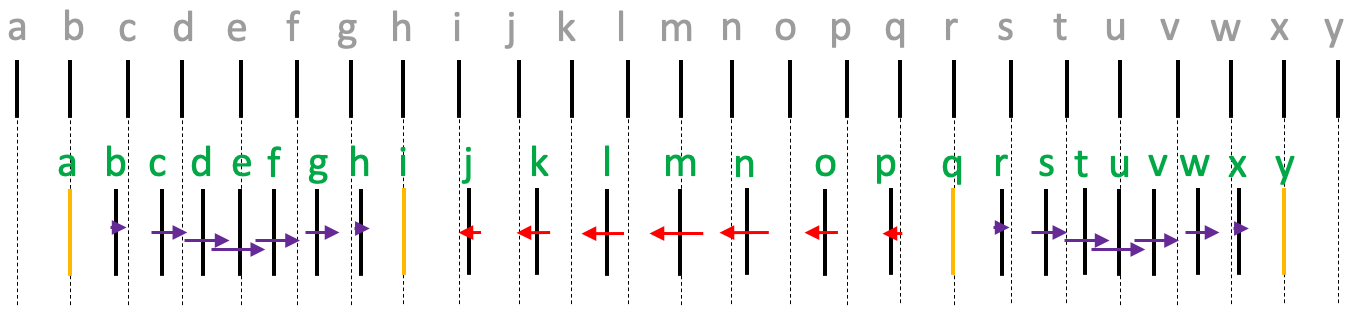 showing the direction of motion of layers at this instant
(with arrow length indicating relative speeds)
Assuming the wave is propagating to the right, that means the centres of compression will be moving to the right and the centres of rarefaction will be moving to the left.
Particle m is currently the centre of rarefaction, however as the wave is moving to the right, particle n will shortly be the centre of the rarefaction. Thus, particle n must be moving to the left (to get it back to its mean position). particles j to p will be moving in the same direction as n and so are also moving to the left.
| Example 3 |
|---|
|
The diagram shows the compressions (C) and rarefactions (R) of air molecules as a sound wave travels through.
The speed of sound in air is 330 m/s. |

| << Back | Waves & Sound | Next >> |