(ADVANCED PHYSICS TOPIC)
Understanding The Atom
Structure of an Atom
J.J. Thomson discovered the electron in 1897, showing that atoms are NOT the smallest division of matter, and that they have some form of internal structure.
Thomson proposed a raisin-cake model (or plum pudding model) of the atom, in which small negative electrons are embedded in a sphere of positive charge.

Kurzon, CC BY-SA 4.0, via Wikimedia Commons
Ernest Rutherford, one of Thomson’s former students, was working with radioactive decay at that time, and termed a form of decay “alpha rays”. Together with two students, he set up an experiment in which alpha rays are projected towards a thin gold foil and the detectors are moved around the set-up to find out where these alpha particles are deflected towards.
| Ernest Rutherford (1871 – 1937) |
|---|
| New Zealand Physicist famous for the discovery of alpha and beta radiation as well as the Rutherford model of the atom. |
Rutherford’s Scattering Experiment
This is the first nuclear physics experiment to be conducted.
Let’s use an analogy. If you are in a dark room, and you want to see what’s in a fishbowl, you shine light at it. The light rays reflect and enter your eyes. That’s how you see what’s in the fishbowl.
Similarly, when we want to see what’s in an atom, we shoot beams of alpha particles at the electrons, and we have receivers all around the atom to capture where they are reflected to. This will help us “see” what’s in the atom.

Kurzon, CC BY-SA 3.0, via Wikimedia Commons
The results showed that:
Most of the alpha particles passed through the gold foil undeflected,
Some of the alpha particles were deflected through a large angle!
This led to Rutherford’s Nuclear Model of the atom: A massive nucleus in the middle, with mainly space between the electrons and the nucleus.

Kurzon, CC BY-SA 3.0, via Wikimedia Commons
Nuclear Structure
What exactly holds protons together? Aren’t they all positively charged? Why don’t they repel each other?
We know that the nucleus is made up of protons and neutrons – we collectively call them nucleons. The proton number (Z) determines the type of element. Each element has its own set of isotopes, where the number of neutrons (N) differs.
The atomic mass unit, u, defined such that the atomic mass of the isotope, Carbon-12, is exactly 12 u. The conversion to SI units is
1 u = 1.6605 × 10⁻²⁷ kg
The mass of a proton is 1.007276 u and the mass of a neutron is 1.008665 u. The mass of one electron is 0.000549 u.
The masses of hydrogen and helium are 1.007825 u and 4.002602 u respectively. Note that the mass of helium is less than the sum of masses of 2 protons and 2 neutrons and 2 electrons. We call it the mass defect, Δm.
Nuclear Stability
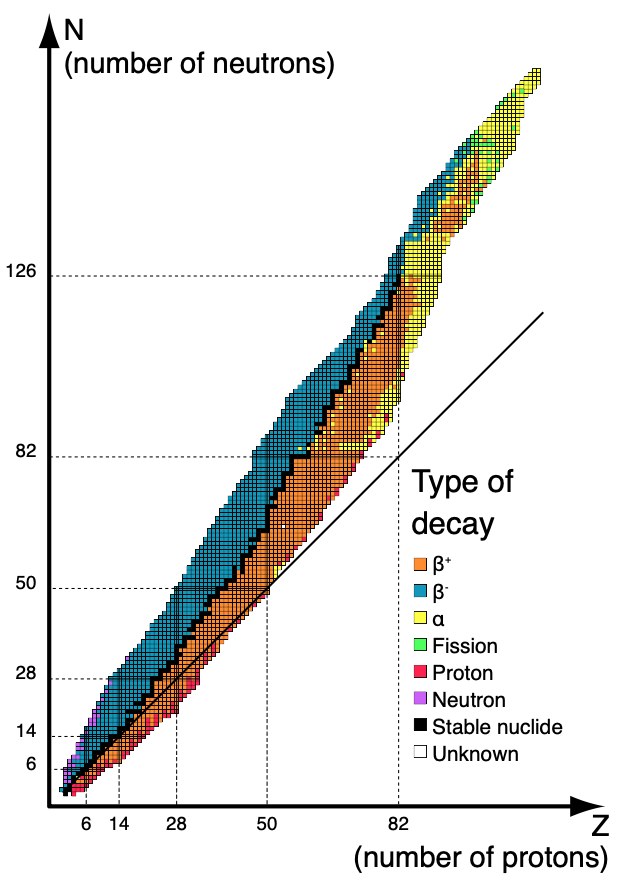
What determines the numbers of protons and neutrons which we see in the elements in the periodic table? Most elements which we see abundantly are considered stable. Unstable nuclei are those which are radioactive.
Here’s a graph which shows a plot of N against Z, and where nuclei are stable or unstable.
Table_isotopes.svg: Napy1kenobiderivative work: Sjlegg,
CC BY-SA 3.0, via Wikimedia Commons
Nuclear stability is highly related to radioactivity.
Forces and Energy in the Nucleus
How can a nucleus ever be stable? Why don’t all the positively-charged protons repel each other. Clearly, another force is at work here – it was named the strong nuclear force. It is a force that is considerably stronger than the repulsive electrostatic repulsive force at short distances and thus is able to hold the nucleus of the atom together. However, it only acts over short distances and cannot be felt at distances larger than about the size of a nucleus.
Each nucleus also has binding energy, which is released when protons and neutrons come together to form a nucleus.
Binding Energy
Earlier, we talked about the mass defect of the Helium atom. So where does the mass go to? It actually forms the binding energy of the atom.
The mass-energy equivalence is one of the most famous equations of physics
E = mc²
Where E is energy (J), m is mass (kg) and c is the speed of light in a vacuum (299 792 458 ms–1).
So the binding energy, B.E., can be thus, related to the mass defect.
B.E. = Δm c²
The binding energy of a nucleus is the energy required to separate the nucleus into its constituents (nucleons) (or the energy released when a nucleus is formed from its constituents).
The change in mass when nucleons fuse is incredibly small, therefore when measuring the mass defect the usual units will be atomic mass units. One atomic unit (1 u) is defined as 1/12th of the mass of a carbon-12 atom.
1 u = 1.661 × 10⁻²⁷ kg
The electron-volt (eV) is used to measure small energies. An electron-volt is the work required to move an electron through a potential difference of one volt. Alternatively, an electron-volt is equal to the kinetic energy acquired by an electron when it is accelerated through a potential difference of one volt.
A particle with charge q gains an energy E = qV after passing through a voltage V.
E=qV
Thus, knowing the charge on the electron, we can determine the energy an electron would gain after being accelerated through 1 V:
qV = 1.60217663×10–19 C × 1 V
So 1 eV = 1.602×10⁻¹⁹ J
1 MeV is also a commonly used unit being one million electron-volts or 1.602×10⁻¹³ J
| Example 1 |
|---|
|
Express the energy represented by a 1 u mass defect in MeV. |
The value quoted in most textbooks is 931.5 MeV of energy.
Binding Energy and Stability of the Nucleus
The curve of binding energy also tells us about how stable each of these stable nuclei actually are. The higher the binding energy, the more stable the nuclei. Since some nuclei are more stable than others, some nuclei can react with others or the environment to attain a more stable state.
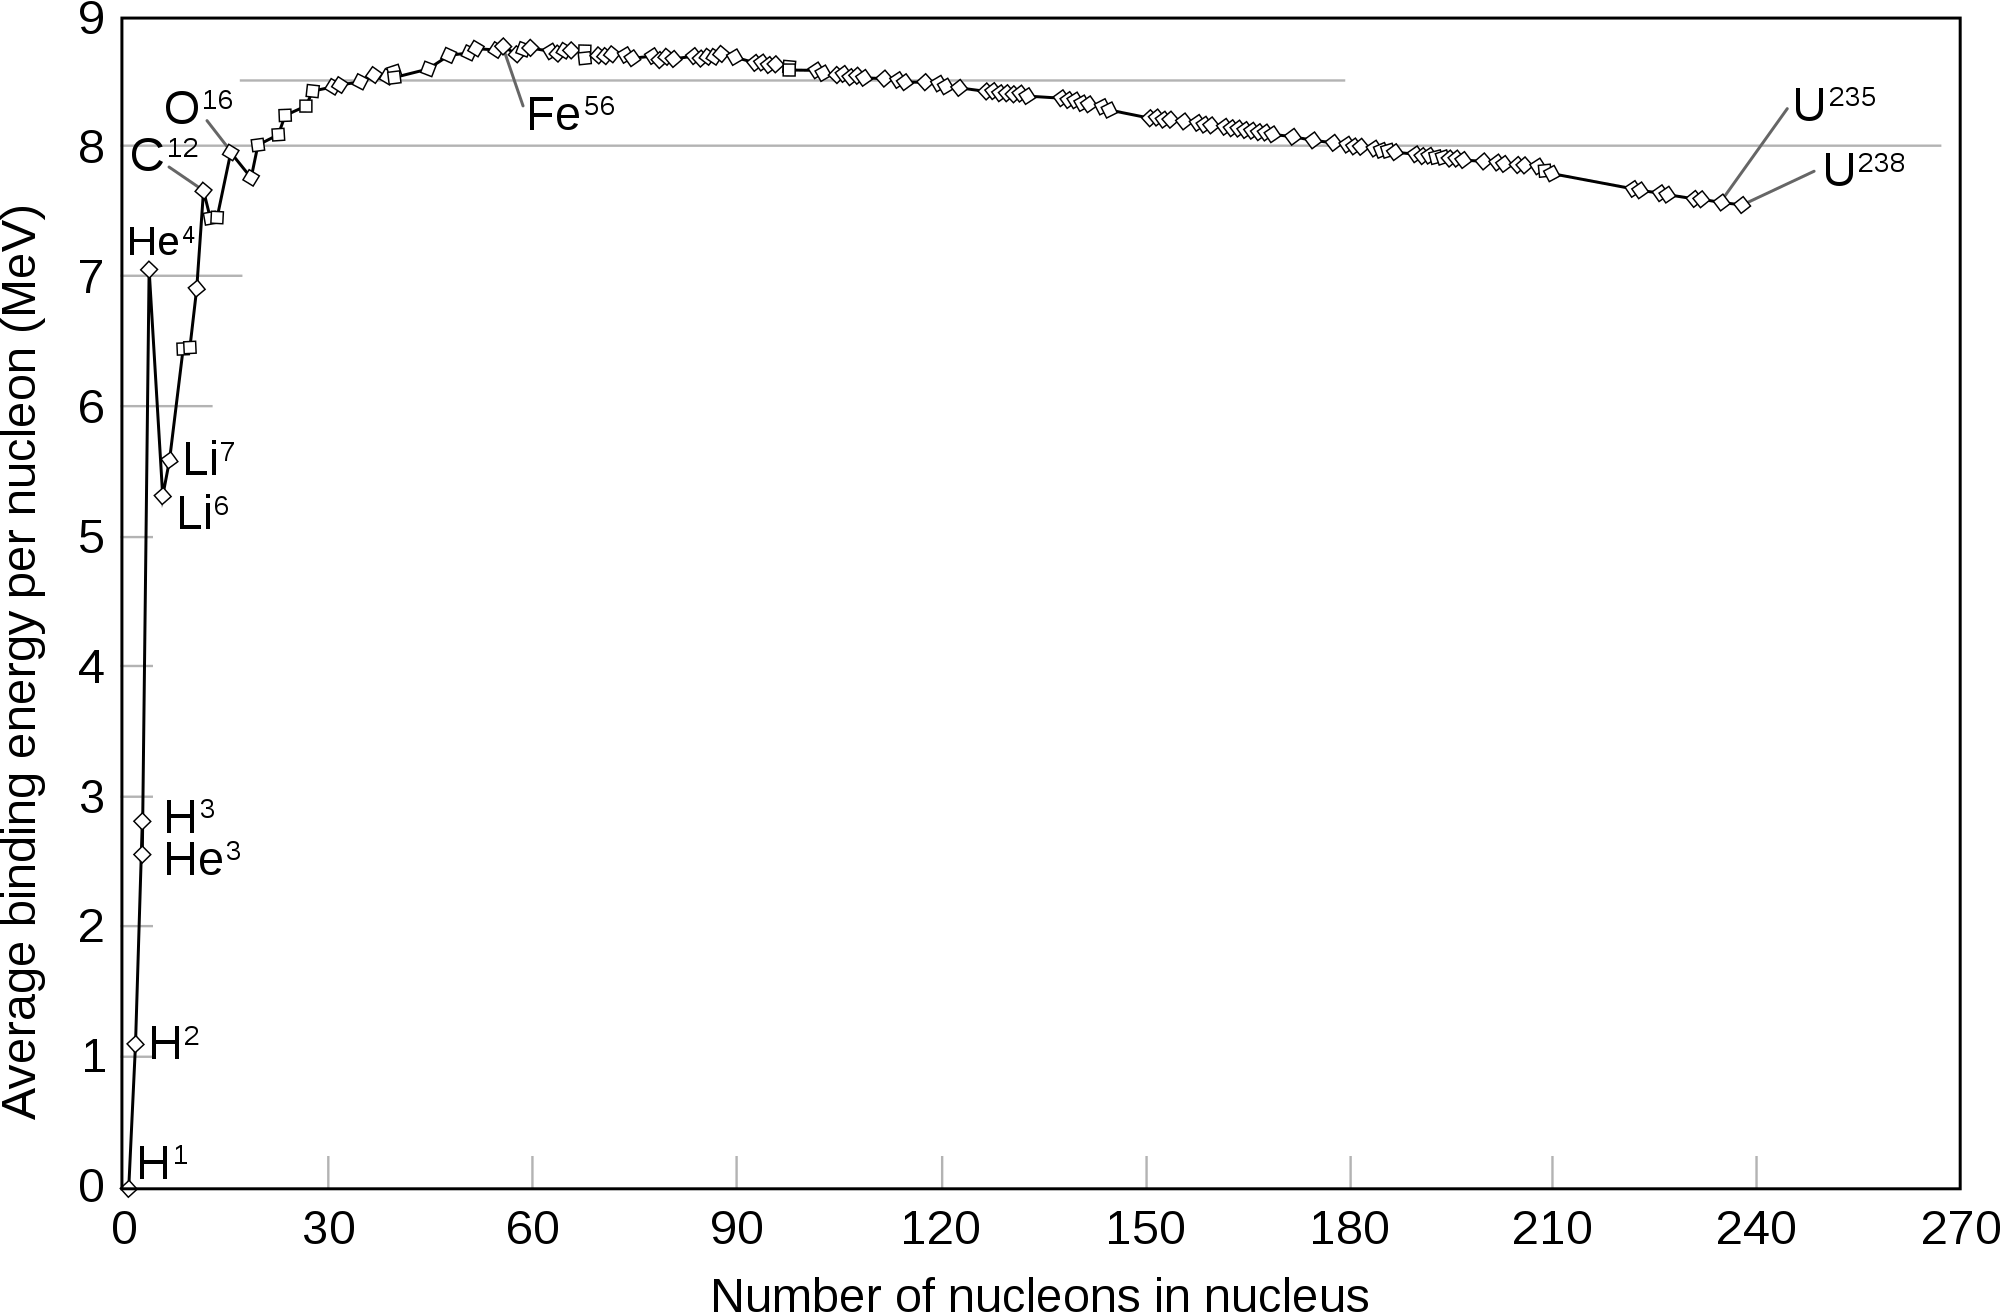
If we look at the binding energies per nucleon for different isotopes we see that the highest value occurs for iron (Fe). The iron nucleus can therefore be considered one of the most stable.
Elements below iron in the periodic table have a higher tendency to undergo nuclear fusion. Elements above iron have a tendency to undergo nuclear fission.
| Example 2 |
|---|
|
The mass defect of a nucleus is 0.0647 u. Calculate its binding energy in MeV. |
| Example 3 |
|---|
|
When a uranium-235 nuclei captures a neutron it undergoes the following fission reaction:
The mass of each component is listed below:
(a) Calculate the total mass loss (in u) during this nuclear reaction.
(b) Calculate the energy released during this fission reaction given that a change of 1 u in mass releases 931.5 MeV of energy. |


Radiation and Radioactive Decay
Nuclear radiation occurs when an unstable nucleus emits energy in the form of EM waves or subatomic particles in order to become more stable.
You have already learnt about α, β– and γ radiation and should be familiar with their properties.
Other decay process are also possible such as:
-
- emission of a neutron,
- emission of a proton,
- electron capture (EC) and
- beta-positive decay β(+).
Positive Beta-Decay:
Oxygen-15 decays by β+ decay into Nitrogen-15.

We can see from this equation that the beta particle is similar to the electron but with a positive charge rather than a negative charge. It is in fact an anti-electron (also called a positron). This is the anti-matter version of an electron, having almost identical properties to the electron but having a positive charge.
In general we get:

Which can be though of as a single decay of a proton within the nucleus and written as:

OR

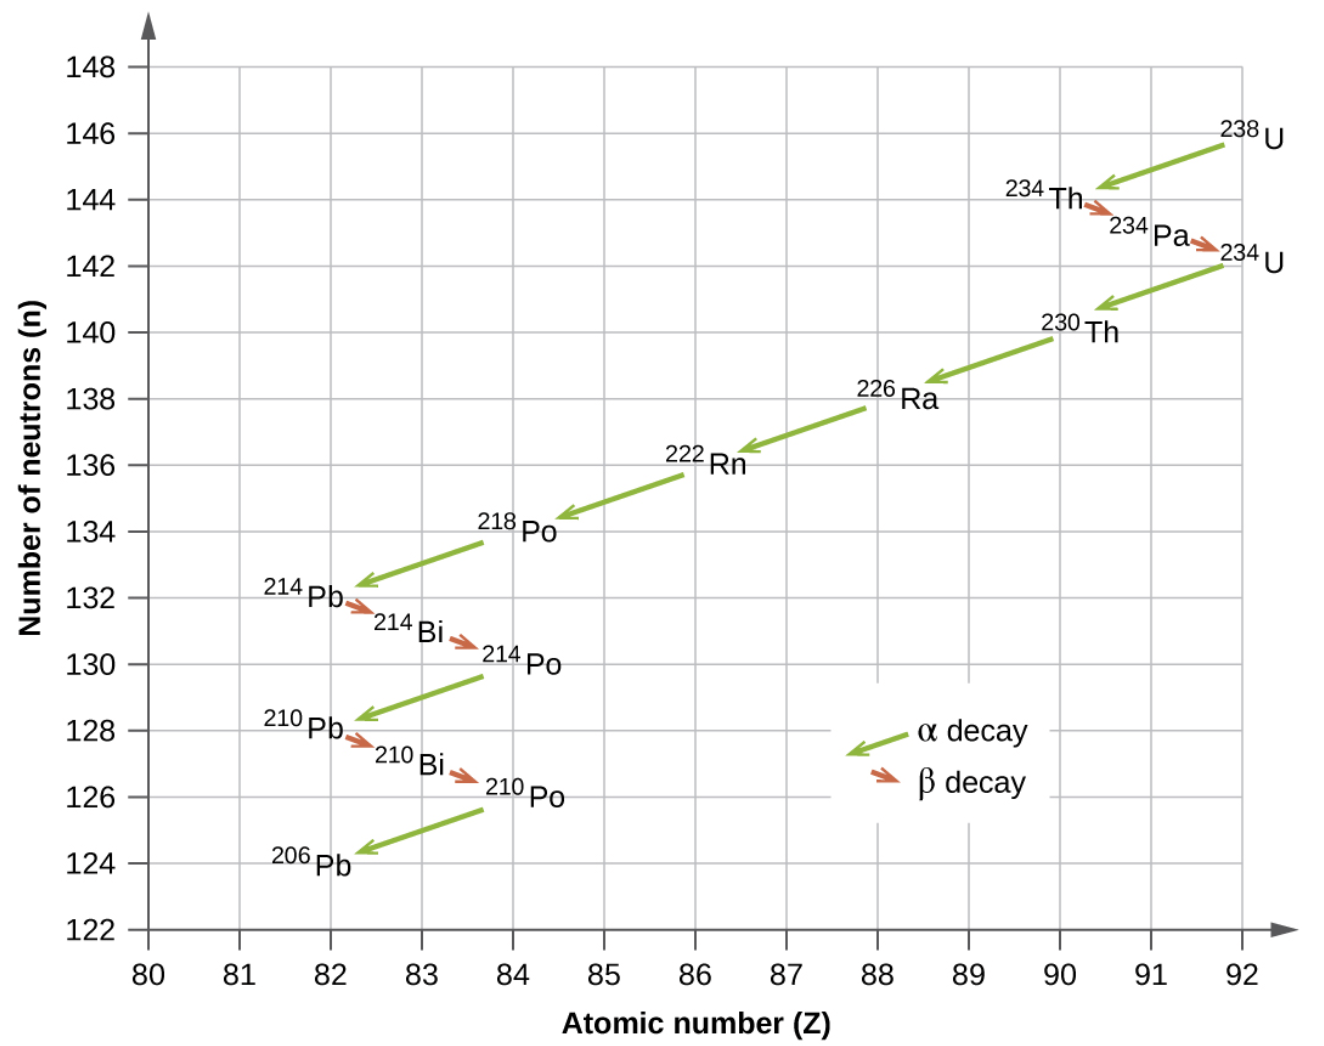
Radioactive Decay Series
Depending on the type of decay that takes place, the daughter nuclei will move to a new location on a chart of N v.s Z:
![]()
MarsRover, GFDL
via Wikimedia Commons
Uranium-238 has a very long half-life the other isotopes all have relatively short half-lives ending at lead-206, which is stable.
Uranium-238 has a very long half-life the other isotopes all have relatively short half-lives ending at lead-206, which is stable.
Half-Life
Radioactive decay is a random process meaning you can’t predict when the next decay will occur.
If you watch a certain population of a specific radioactive nuclide over time the number of nuclei will decrease as they decay.
The population-time graph below shows the population (number) of radioactive nuclei remaining.

It is noticed that the number of nuclei (the remaining population, N) halves at fixed time intervals. We call this time taken for half the nuclei to decay the half-life of the nuclide.

Half-life, T1/2, is a time and can vary from less than a nano-second (for very, very unstable nuclides) to many billions of years.
| Wikipedia List of radioactive half-lives |
The rate of nuclear decay thus follows an exponential decay function.
At a particular time , t, the gradient of this line gives us the number of particles decaying per unit time. This is referred to as the activity of the sample, A.
Thus the gradient is constantly decreasing as the population of radioactive nuclei decrease. i.e. the activity will decrease over time.

This be expressed mathematically as:

Where ΔN /Δt is known as the activity of the sample, A, and is expressed in units of Bq.
A given radioactive nucleus will have a constant decay probability denoted by λ, and known as the decay constant, which is the probability of a nucleus decaying per unit time. This value can be calculated by finding the change in the number of nuclei (ΔN) of a sample per time (Δt), divided by the initial number of nuclei (N)
(Don’t worry about the negative sign – that’s a result of the population decreasing –frequently we will only care about the magnitude anyhow.)
Thus:

Interestingly, as activity is seen to be proportional to the population (N), both graphs will have the same shape.
As can be seen here the activity of the sample shows the same exponential decay as the graph of population showed.

An activity-time graph is more frequently seen that the population-time graph as activity is easier to measure (it’s just the reading from the GM counter).
The relationship between half-life and decay constant is given by:

Where ln2 is the the natural logarithm of 2 which is equal to 0.69314…)
| Example 4 |
|---|
|
In a sample of radioactive isotopes 1.8×10⁵ nuclei decay over a time period of 1 hour. Determine the average activity of the sample. |
| Example 5 |
|---|
|
Radium-226 has a half-life of 1622 years. A rock is found with 1.5×10¹² radium-226 nuclei. Calculate the activity of the rock due to the decay of radium-226. |
| Example 6 |
|---|
|
A sample of wood containing 5.12×10¹² atoms of carbon-14 has an activity of 20 Bq. Calculate the half-life of carbon-14. |
| << Back | Radioactivity |