This page considers both speed-time graphs and velocity-time graphs. Both of which can be referred to as v-t graphs.
Unless told otherwise, we will assume all v-t graphs are velocity-time graphs.
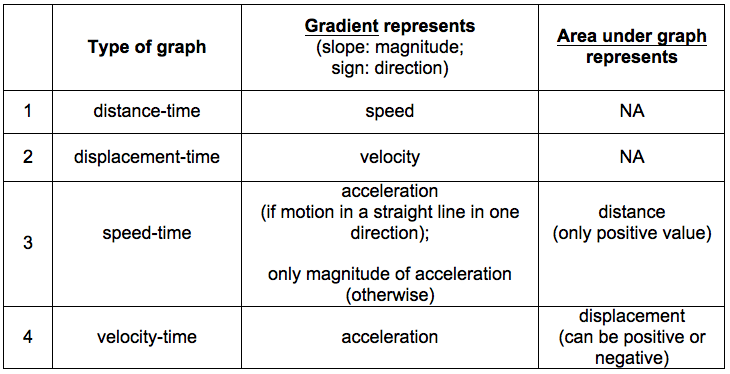
Information obtainable from a velocity-time (v-t) graph
The gradient of the v-t graph is equal to the acceleration of the object.
The area under the line of the v-t graph is equal to the displacement of the object.
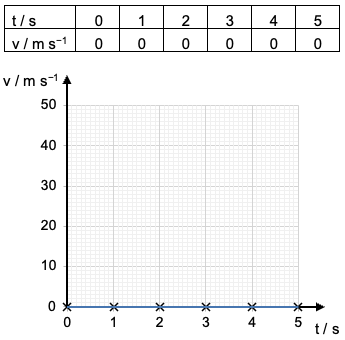
Situation 1 – At Rest (Zero Velocity)
The object is not moving.
Graph:
The gradient of v-t graph is zero.
Motion:
The body remains at rest (with zero acceleration)
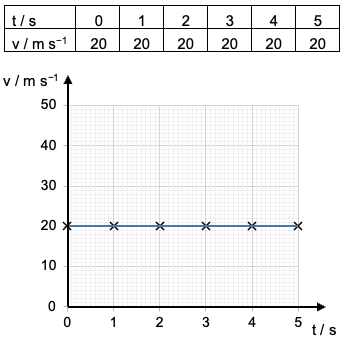
Situation 2 – Uniform Velocity
The object is moving at a constant speed.
The velocity is positive.
Graph: The gradient of v-t graph is zero.
Motion:
The velocity of the body is constant or the body moves with zero acceleration.
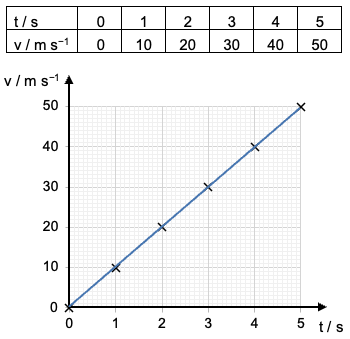
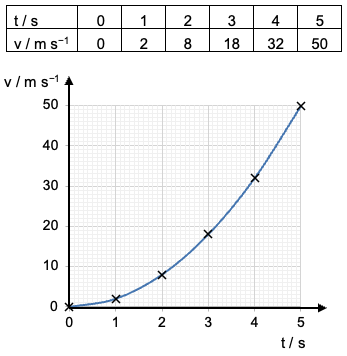
Situation 3 – Uniform Acceleration
The object is speeding up.
The velocity as positive.
Graph:
The magnitude of velocity increases and the gradient is constant.
Motion:
The velocity of the body increases at a constant rate, or the body moves with constantacceleration.
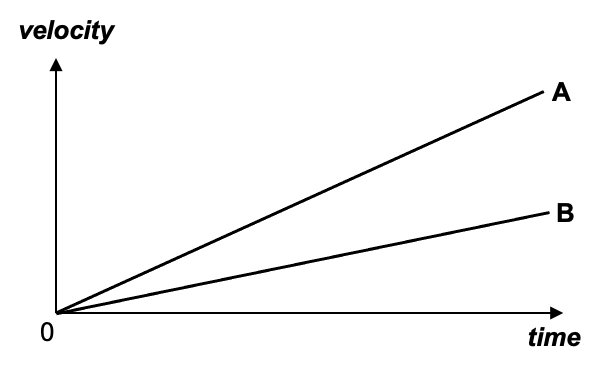
Example 1
Compare the motions of object A and object B.
Both A and B start from rest and have constant accelerations.
The acceleration os object A is larger than that of object B.
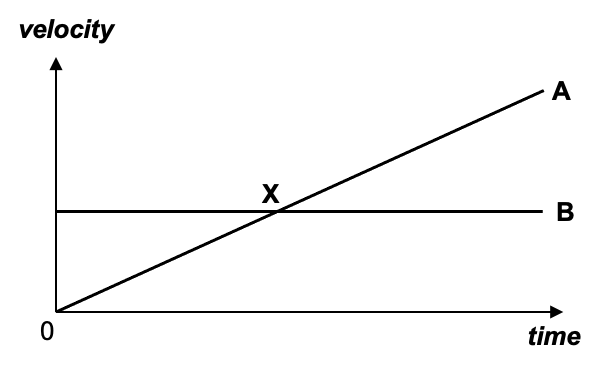
Example 2
What is happening at X?
Object A undergoes constant acceleration from rest.
Object B travels with a constant velocity.
At X both A and B have the same velocity.
Caution
You would be wrong to say “A is overtaking B“. We cannot see displacement from this graph – it is not an s-t graph.
Situation 4 – Increasing Acceleration
The object is speeding up.
The velocity as positive.
Graph:
The magnitude of velocity increases and the gradient is increasing.
Motion:
The velocity of the body increases at an increasing rate, or the body moves with increasingacceleration.
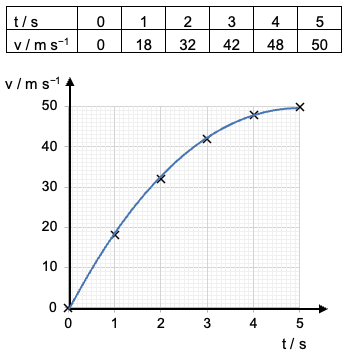
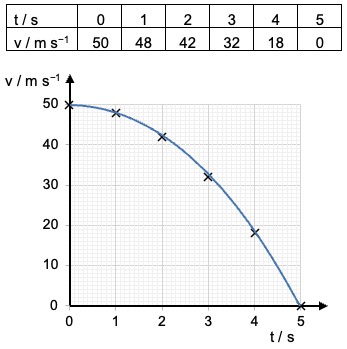
Situation 5 – Decreasing Acceleration
The object is speeding up.
The velocity as positive.
Graph:
The magnitude of velocity increases and the gradient is decreasing.
Motion:
The velocity of the body increases at a decreasing rate, or the body moves with decreasingacceleration.
Note that situations 3, 4 & 5 are all examples of accelerations (i.e. objects increasing in speed).
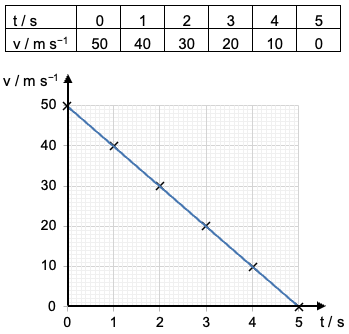
Situation 6 – Uniform Deceleration
The object is slowing down.
The velocity as positive.
Graph:
The magnitude of velocity decreases and the gradient is constant.
Motion:
The velocity of the body decreases at a constant rate, or the body moves with constantdeceleration.
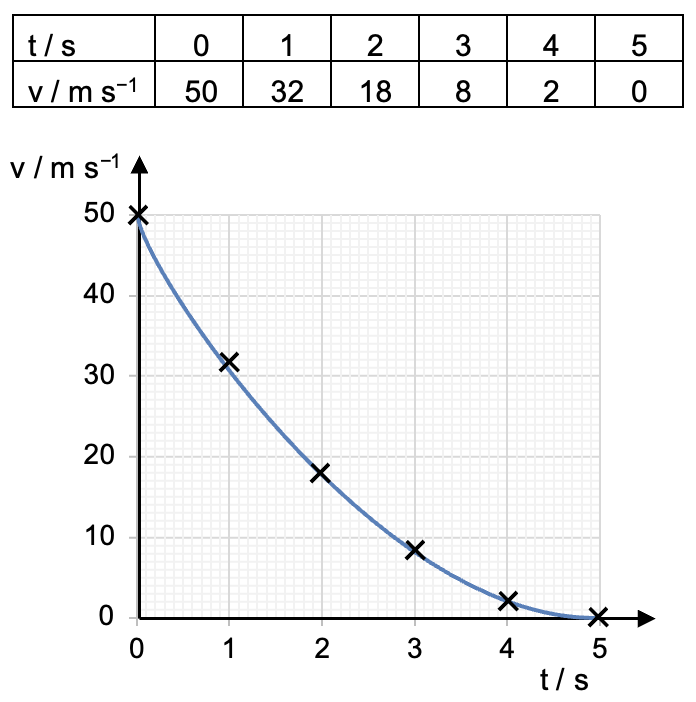
Situation 7 – Increasing Deceleration
The object is slowing down.
The velocity as positive.
Graph:
The magnitude of velocity decreases and the magnitude of the gradient is increasing.
Motion:
The velocity of the body decreases at a increasing rate, or the body moves with increasingdeceleration.
Situation 8 – Decreasing Deceleration
The object is slowing down.
The velocity as positive.
Graph:
The magnitude of velocity decreases and the magnitude of the gradient is decreasing.
Motion:
The velocity of the body decreases at a decreasing rate, or the body moves with decreasingdeceleration.
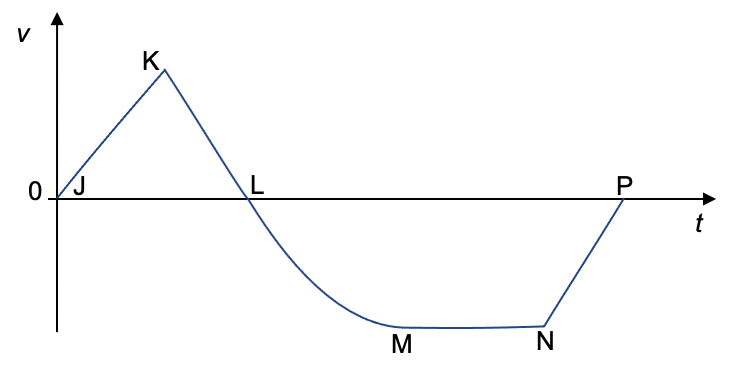
Example 3
Describe the motion of the object in the different sections of its journey.
JK: Constant acceleration
KL: Constant deceleration
LM: Decreasing acceleration
MN: Constant velocity
NP: Constant deceleration
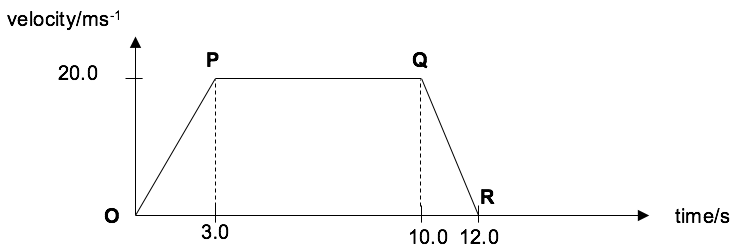
Example 4
A car of mass 800 kg is traveling along a dry and long straight road. The graph below shows the resulting velocity-time graph of the motion.
(a) Describe the motion of the car during the 12.0 seconds of its motion.
From 0.0 s to 3.0 s, the car accelerates uniformly at 6.67 m s-2.
From 3.0 s to 10.0 s, the car moves with a constant velocity of 20.0 m s-1.
From 10.0 s to 12.0 s, the car decelerates uniformly at 10.0 m s-2.
(b) Calculate the distance d travelled by the car in the 12.0 seconds.
Distance = area under the graph
= ½ (7.0 + 12.0) (20.0) {recall: area of trapezium = ½(a+b)h}
= 190 m
(c) Calculate the acceleration a of the car during the first 3.0 seconds.
Acceleration = gradient of graph {OR a =(v-u) / t}
acceleration = 20.0 / 3.0
a = 6.7 m s⁻²
(d) Determine the acceleration a of the car at time t = 11.0 s.
acceleration = gradient of graph at t=11.0 s
{As we have constant acceleration from t=10.0 s to t=12.0 s, we can find the gradient of this whole section of the graph}
= –20.0 / 2.0
= –10 m s⁻²
(e) Explain whether the speed-time graph of the car would differ from the graph above.
The speed-time graph would be identical. Since there was no change in the direction of travel of the car, there was no change in the sign of the velocity values. Hence all the velocity values are the same as the speed values.
(f) The driver of the car stepped on the brake because he saw a child dashing across the road. If his reaction time is 0.50s, and the child was 40 m away from the car when he first saw the child, would the driver have hit the child?
The braking starts at 10.0 s. Thus, if reaction time is 0.5 s, the driver saw the child at t=9.5 s.
Distance travelled before the car comes to a complete stop = distance under the graph between 9.5 s to 12.0 s
= ½ (0.5 + 2.5) (20.0) {area of trapezium = ½(a+b)h}
= 30 m
The car would not hit the child.
Remember the area under the line of the graph is a representation of the total displacement moved by the object.
Example 5
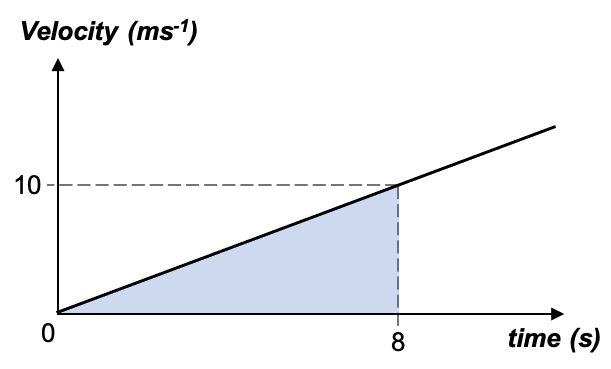
What is the distance moved by the object in the first 8 s?
distance travelled = area under the line of the v-t graph
= ½ × 10 × 8
= 40 m
We do not have to consider the whole motion (whole graph). Instead by looking at a certain section (time period) of the graph we can determine the displacement of the object within that time period.
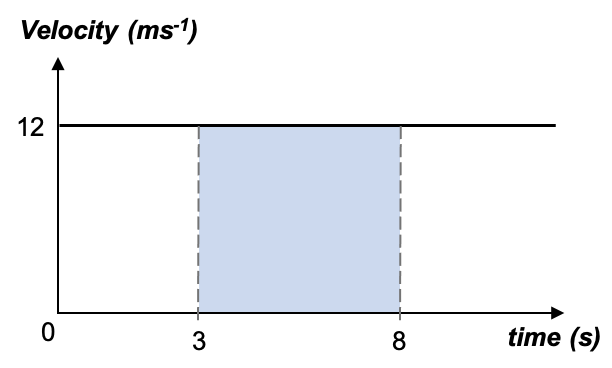
Example 6
What is the distance travelled by the object between t = 3 s and t = 8 s?
distance travelled = area under the line of the v-t graph
= 12 × (8 − 3) = 12 × 5
= 60 m
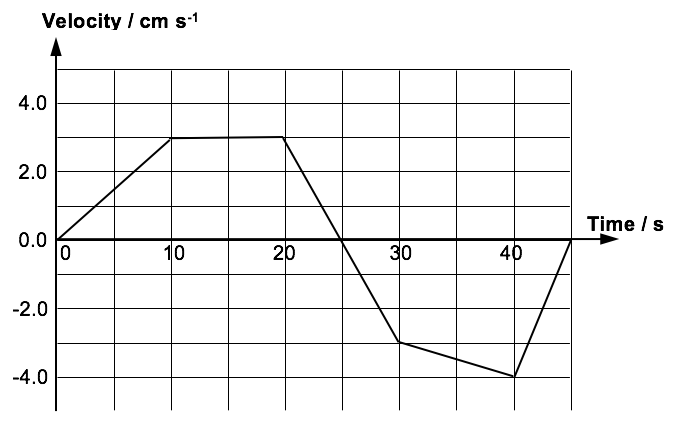
Example 7
What is the displacement of the following object at 45 s?
Area under graph for t=0 s to t=25 s is:
=½×10×3.0 + 10×3.0 + ½×5×3.0 = 52.5 cm
This is a positive displacement as the velocity is in the positive direction for these 25 s.
Area under graph for t=25 s to t=45 s is:
=½×5×3.0 + 10×3.0 + ½×10×1.0 + ½×5×4.0 = 52.5 cm
We can take this as a negative displacement (as it is below the time (x-) axis) for these 20 s.
As the two areas are in fact equal for this question, it can be concluded that the object returns to the starting point ( i.e. total displacement is zero).
For most questions the areas should easily be broken up into rectangles and triangles. Often the shape will be a trapezium.
Area of trapezium = ½ × (sum of parallel sides) × (height)
Summary of Key Features of Motion Graphs
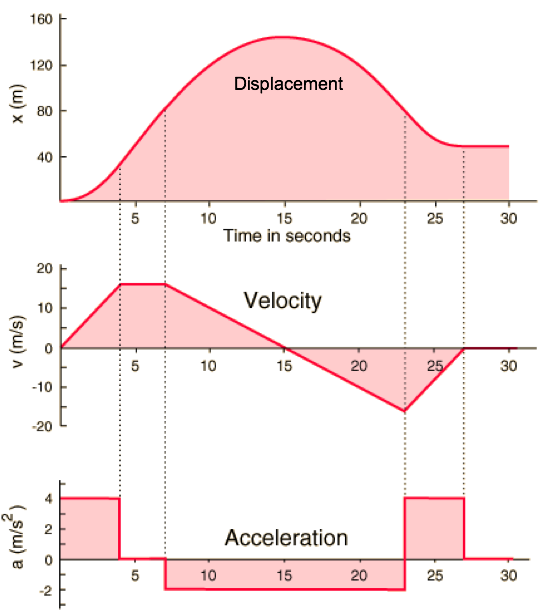
Same Motion, Different Graphs
The three graphs below depict the same motion of an object.
The information that each is telling us about the motion is summarised below: