Tables are a clear way of presenting lots of data in a clear, logical, easy-to-read manner.
The good practices in tabulation are summarised below:
- Conventional symbols and appropriate units are used for headings, e.g. L / m.
- The first column of the raw data should be the independent variable.
- There should be at least six sets of readings for a straight line graph and at least 10 sets of readings for a curved graph.
- The independent variables should be arranged in increasing order, if possible.
- The intervals between consecutive independent variable values should be regular.
- Measurements of dependent variables are repeated to obtain an average value.
- Raw data are given to the same degree of precision (i.e. same number of decimal places).
- Raw data should appear on the left side of the table before the processed data.
Example:
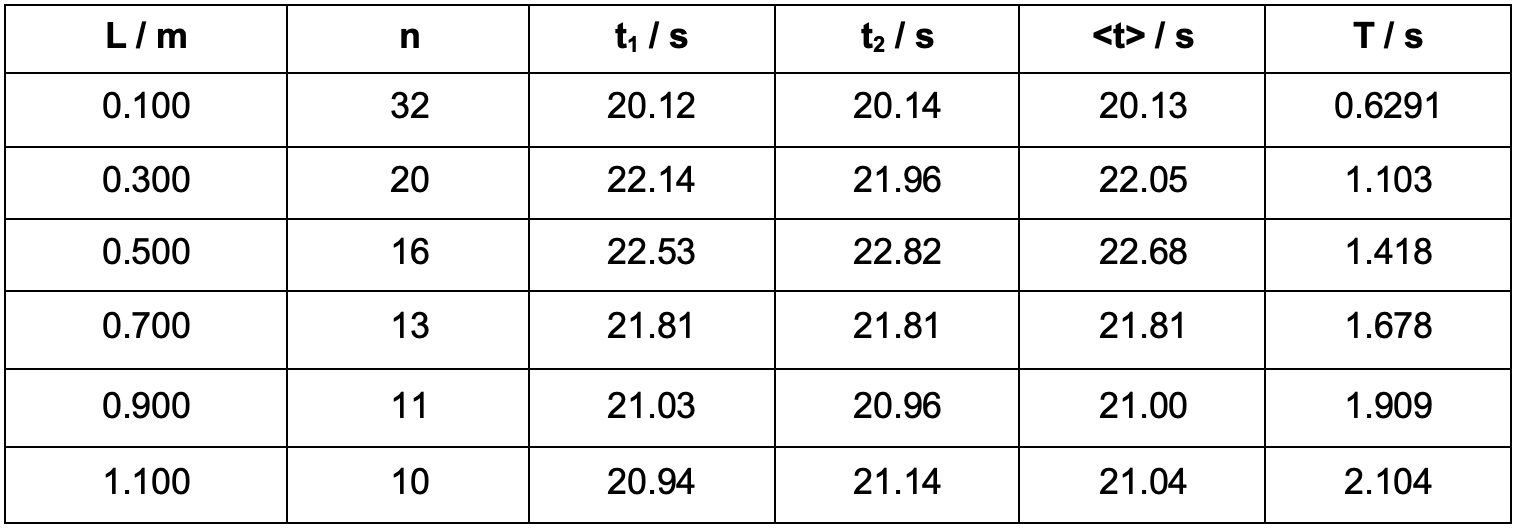
In a pendulum experiment, the length of the string (L) and the time taken (t1, t2) for different number of oscillations (n) are measured. The measurements are shown below:
| Note |
|---|
|
The above table is purely for illustration, in a typical pendulum experiment, we typically time for 20 oscillations for each trial instead of timing for a different number of oscillations (n). |
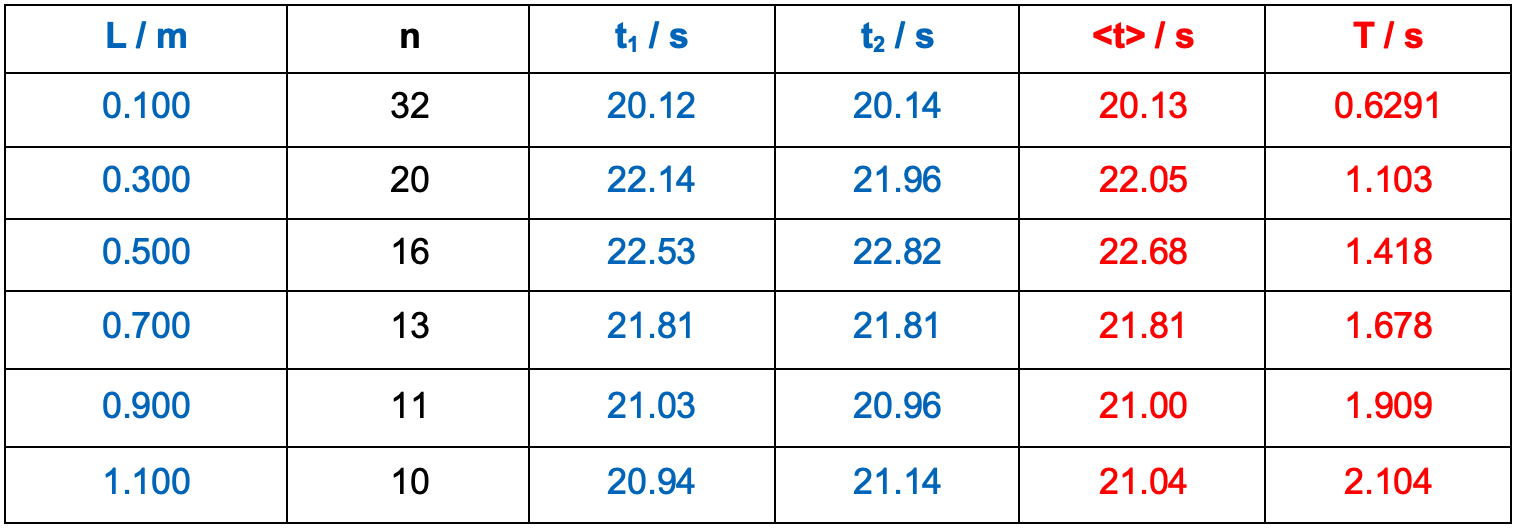
Raw data (ie data measured directly from an instrument) is shown on the left (in blue) and the processed data on the right (in red).
‘n’ could be considered raw data (it is the number of oscillations counted), but is not measured by any instrument, and the whole number here can be treated as exact.
Raw Data:
These are values obtained directly from measuring instruments:
-
-
- Length of string (L) is measured using a metre rule.
- Time taken (t1, t2) are measured using a digital stopwatch.
-
The length of the string is measured up to 3 d.p. in metres according to precision of the ruler. Similarly, time is measured up to 2 d.p. in seconds according to the precision of the stopwatch.
Processed Data:
The last two columns contain processed data.
The average time <t> can be obtained using <t> = (t1 + t2) / 2
When the length of string is 0.300 m, (t1 + t2) yields 22.05 s (2 d.p.) because it is addition. When this answer is divided by 2, the final answer will have the least significant figure which is 4 s.f. This is because ‘2’ is a constant.
The period can be obtained from T = <t> / n
When <t> is divided by ‘n’, which is a constant number, the final answer will yield a value with the least number of significant figures. In this case, it is 4 s.f. because ‘20’ is a constant.
| Basics |