Analysis of given equation
- A physics phenomenon can be modelled using an equation.
- When the dependent variable is plotted against the independent variable, if a straight line graph is obtained, there is a linear relationship between these two variables.
- If the graph is not a straight line, the relationship is non-linear.
- We can apply Linear Law to transform a non-linear relationship to a linear form to determine unknown constants from the straight line graph.
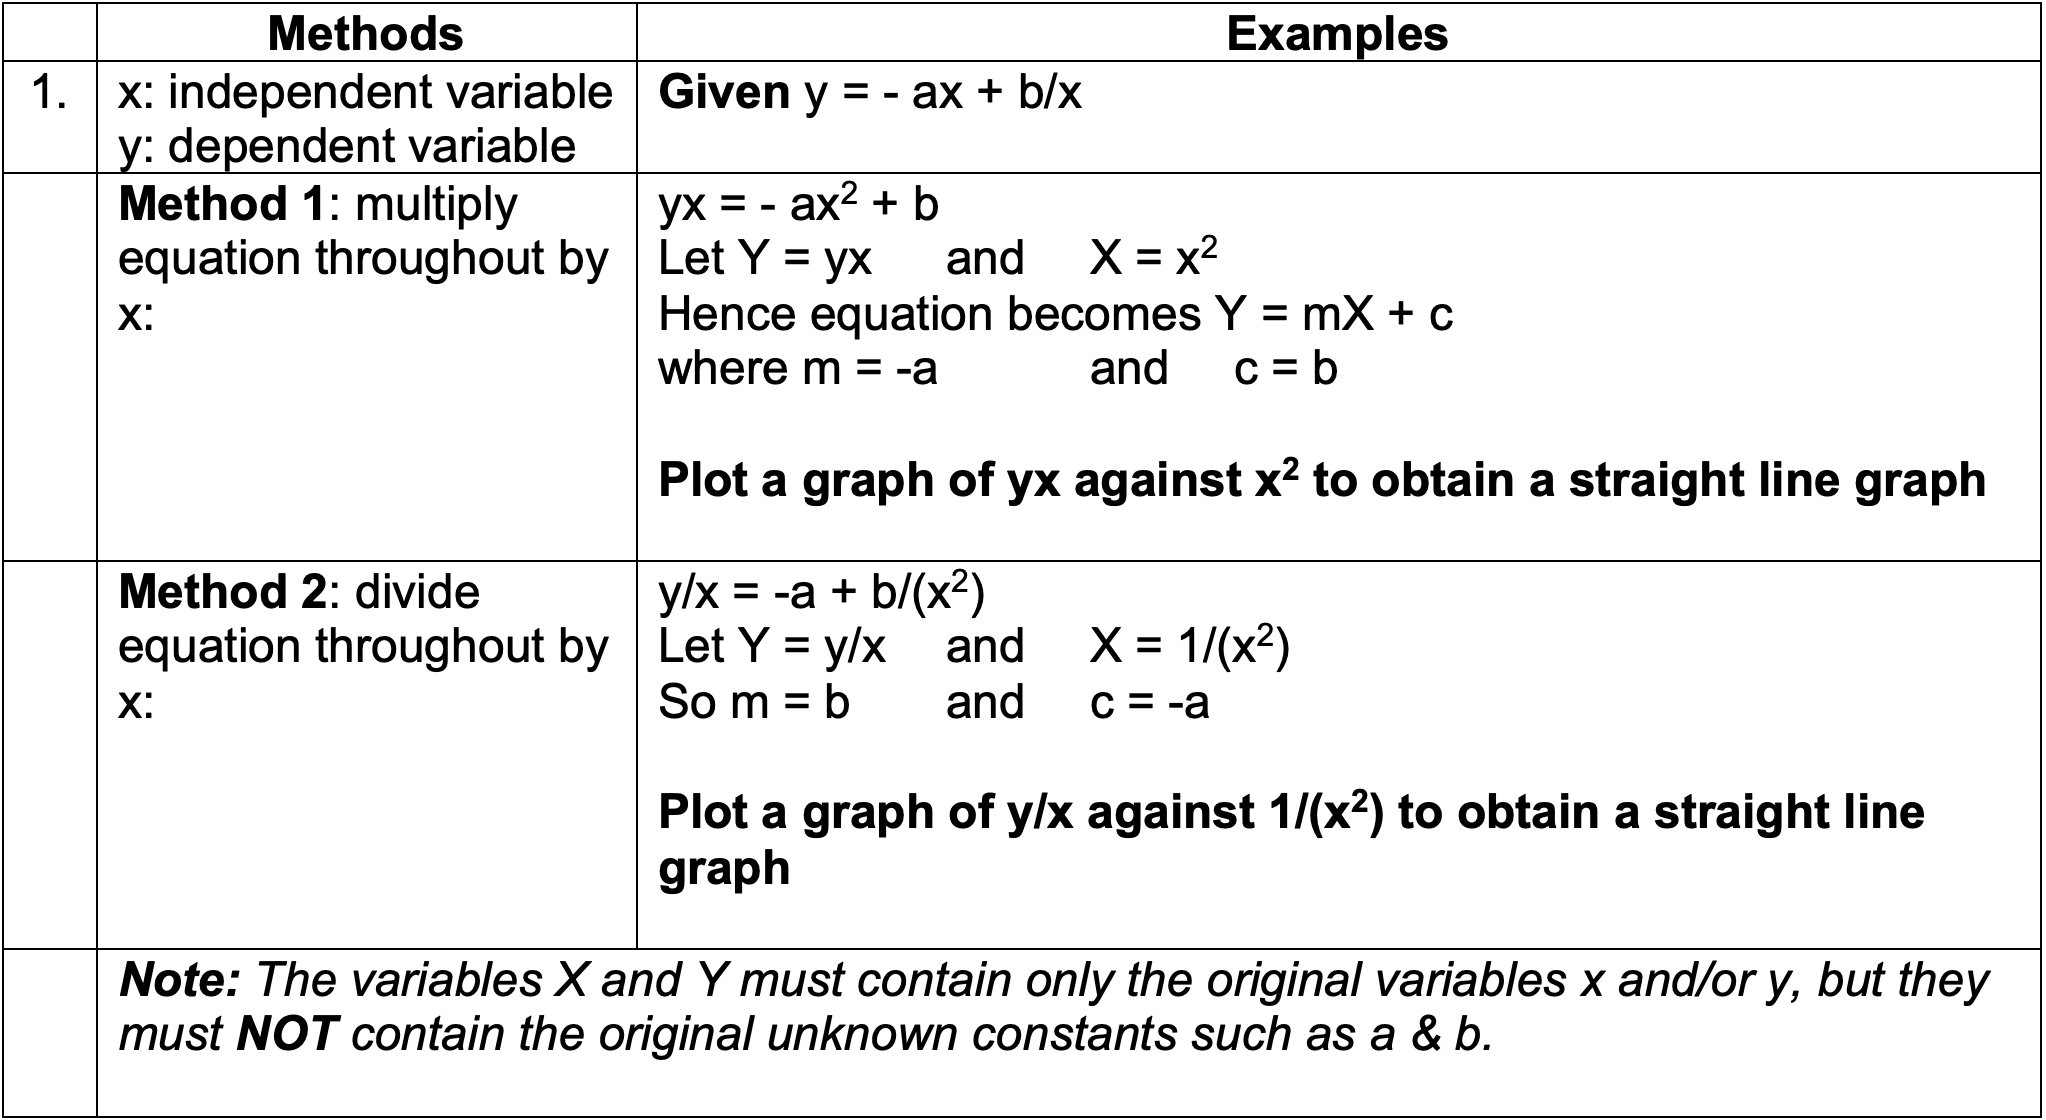
Y = mX + c
where,
m = gradient of graph
c = Y-intercept
| Example |
|---|
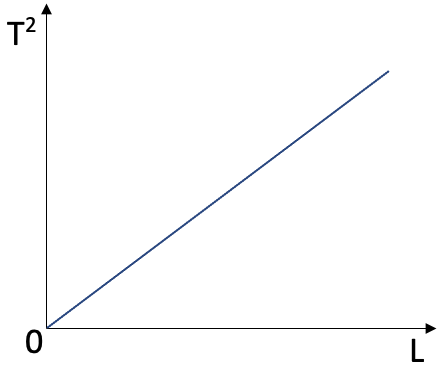
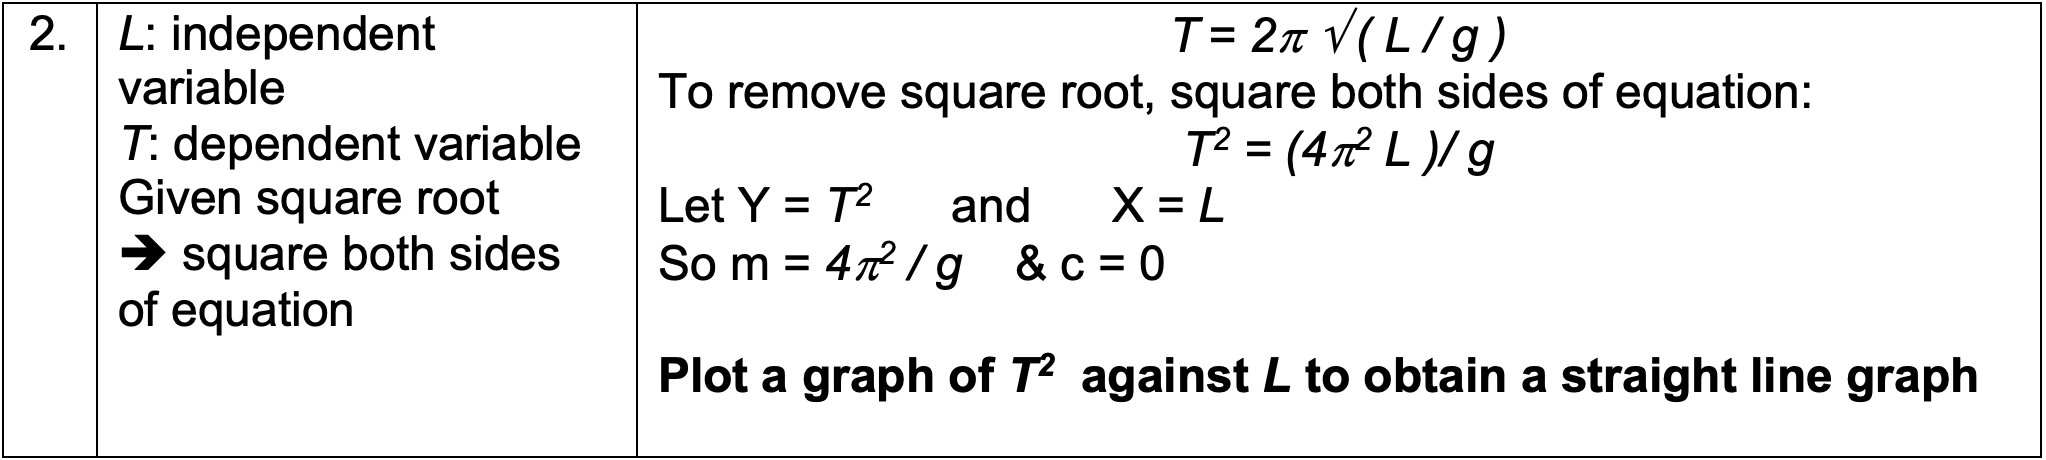
| The period of a pendulum, T, is related to the length, L, of the pendulum by the equation:
T = 2π √(L/g) What graph would you plot to verify this equation? To separate L from g we can square both sides of the equation: T² = (4π²L)/g Plotting a graph of T² (y-axis) against L (x-axis) will give a straight line graph with y-intercept at 0 and gradient, m = 4π²/g.
|
| << Back | Basics |