An overview: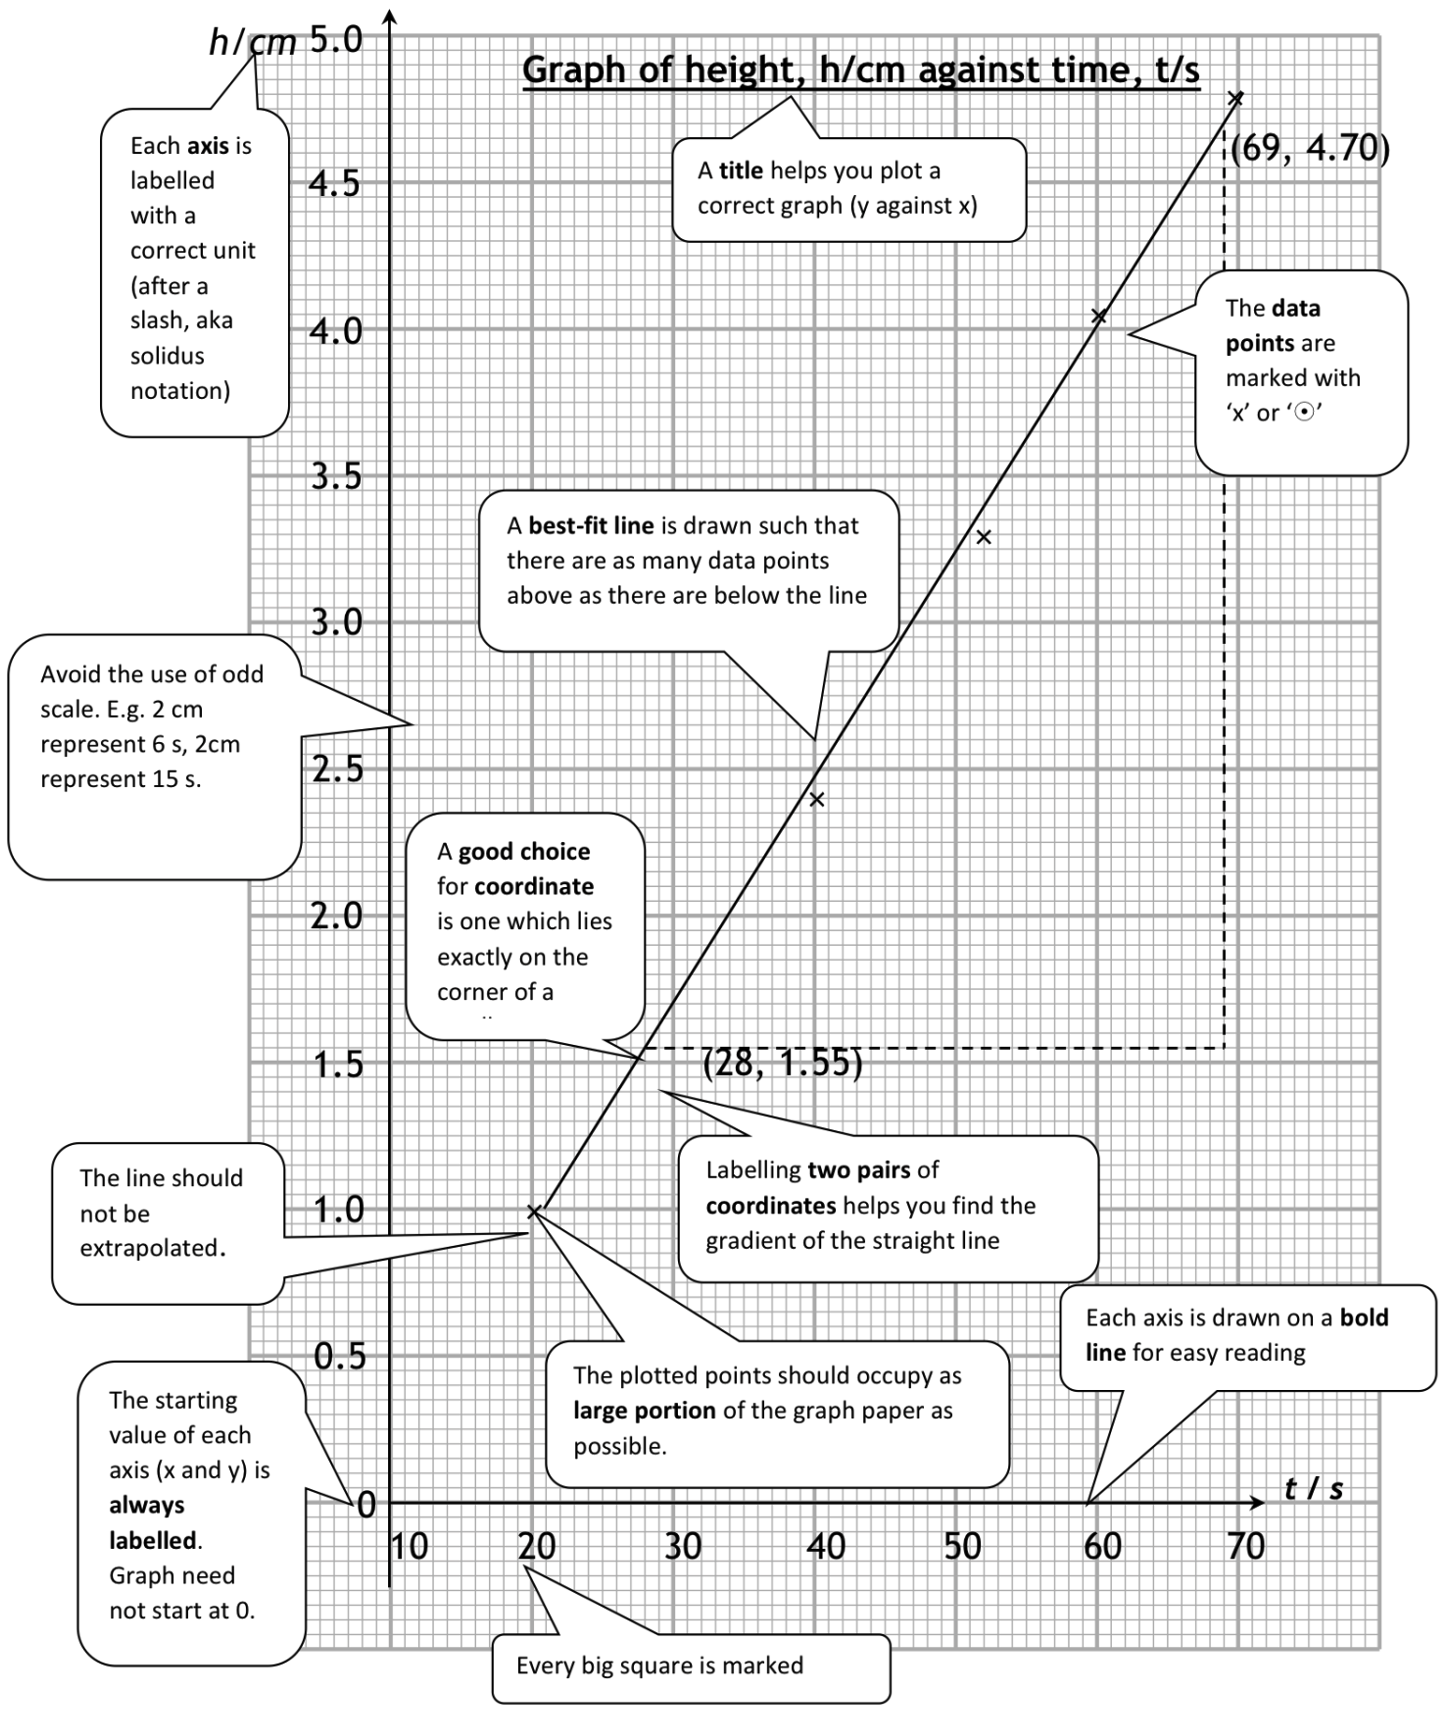
Plotting a Graph
- Material needed to plot a graph:
-
- Graph paper with grid square of 2 mm by 2 mm.
(Note: the graph paper can used in either landscape or portrait orientation) - 5 mm mechanical pencil with HB lead (graph must be plotted in pencil)
- Clean eraser
- Transparent flexible 30 cm ruler
- Flexi-curve
- Graph paper with grid square of 2 mm by 2 mm.
- Take note of the following important points when plotting a graph:
(a) Convention of drawing a graph
If you are asked to plot a graph of:
T2/s2 against L/m
-
-
-
- The first quantity (T2) is along the vertical-axis (y-axis).
- The second quantity (L) is along the horizontal-axis (x-axis).
-
-
(b) Axes
-
-
-
- Both axes must have arrowheads at the ends.
- Both axes must be labelled correctly according to the headers in the table of readings to the full precision.
- The intersection of the axes must be labelled clearly.
-
-
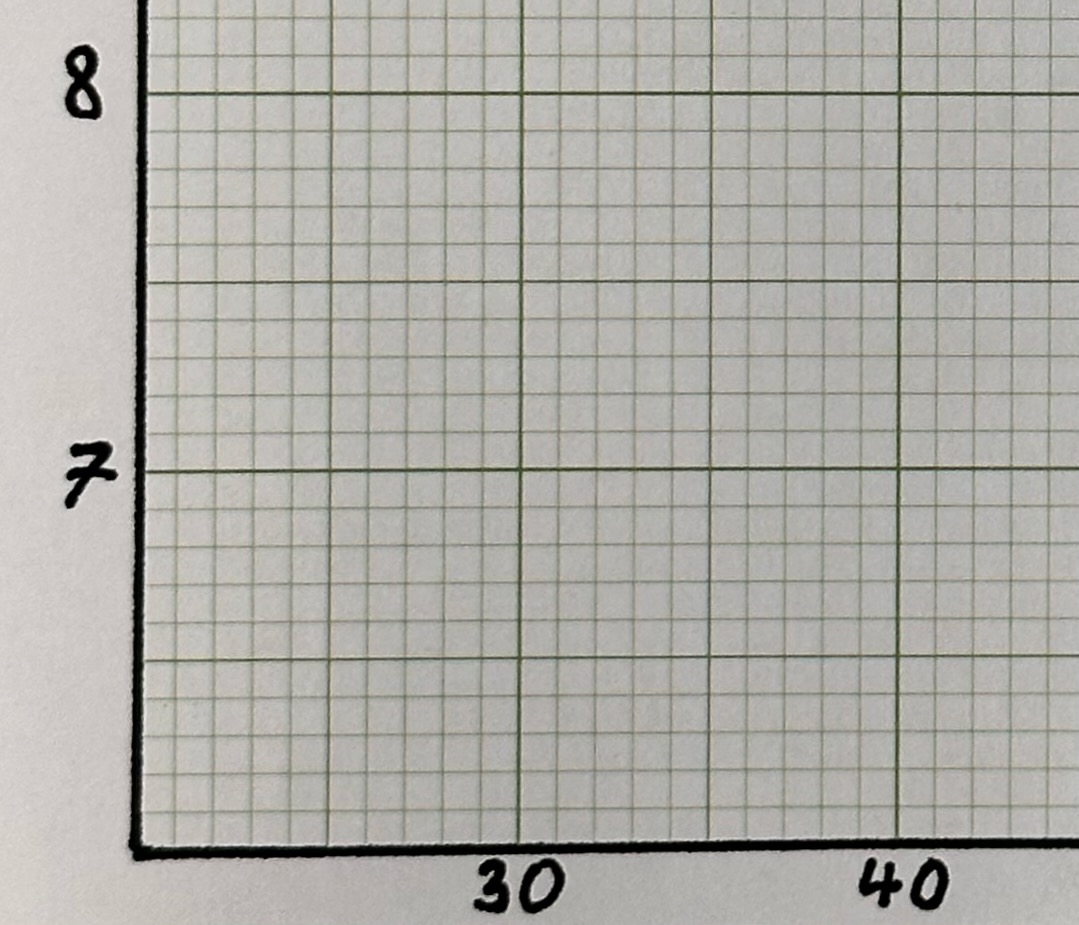
(c) Scales
-
-
-
- Graph axes need not begin at the origin (0, 0) unless special conditions are required.
-
-
Special conditions could be:
-
-
-
-
-
- The y-intercept is required. For y-intercept the horizontal axis must start from zero but the vertical axis need not start from zero.
- You are required to comment if your graph passes through the origin.
- You are instructed to draw your graph through the origin or start from the origin.
-
-
-
-
-
-
-
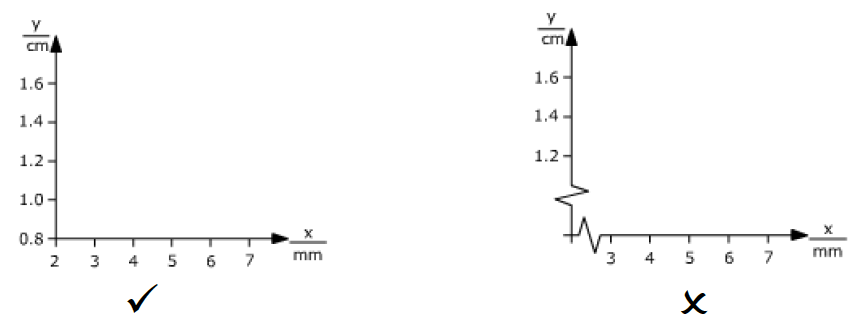
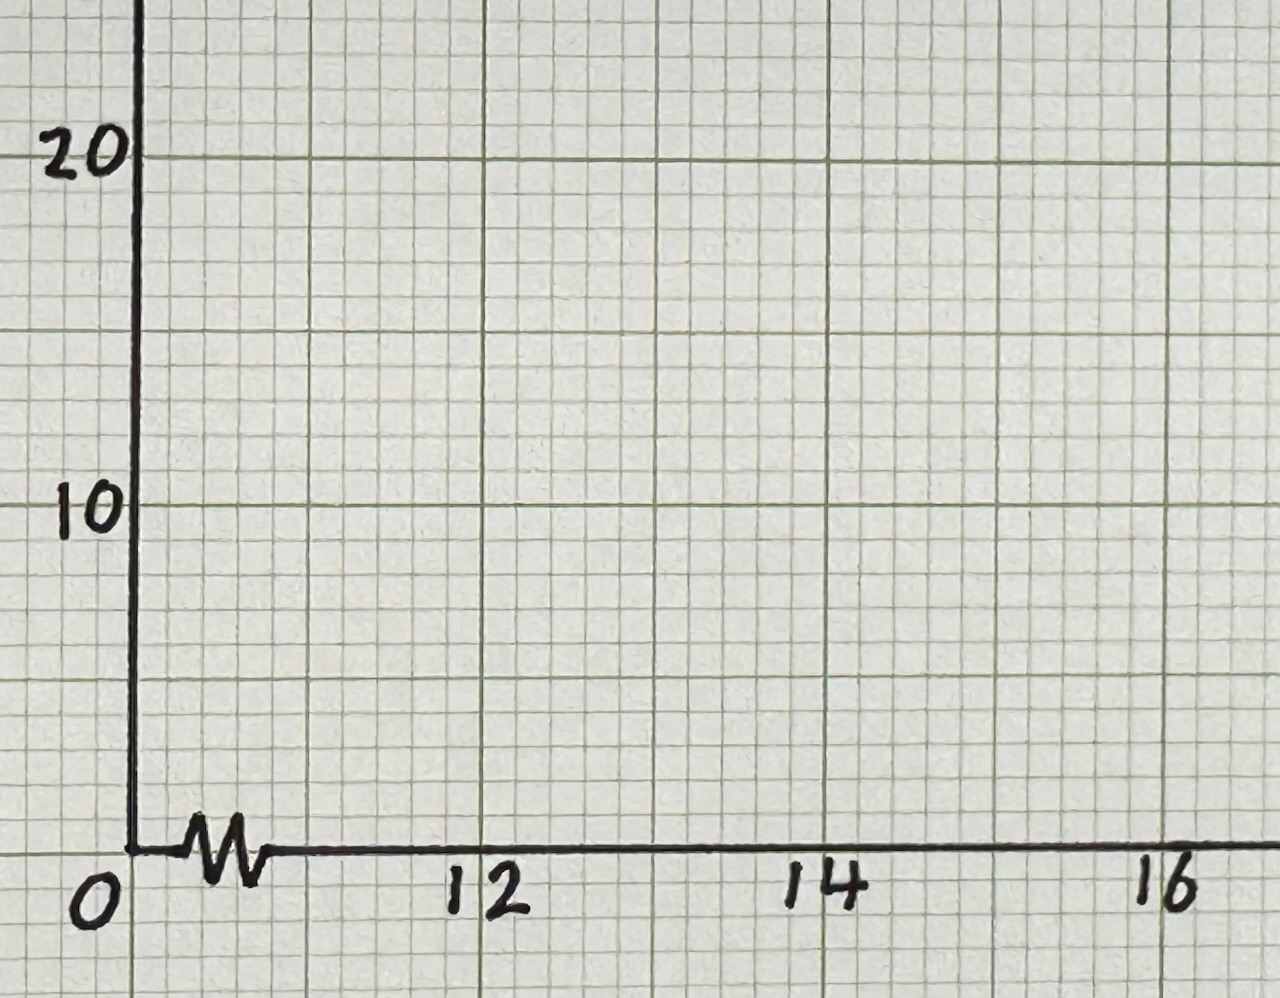
- DO NOT draw zig-zag lines on the axis to indicate a non-continuous axis.
-
-
-
-
-
- Firstly, check the minimum and maximum range of the raw data that you are going to plot on the graph.
- Select your scales correctly such that your graph covers as much as possible but aim for 75% of the graph paper.
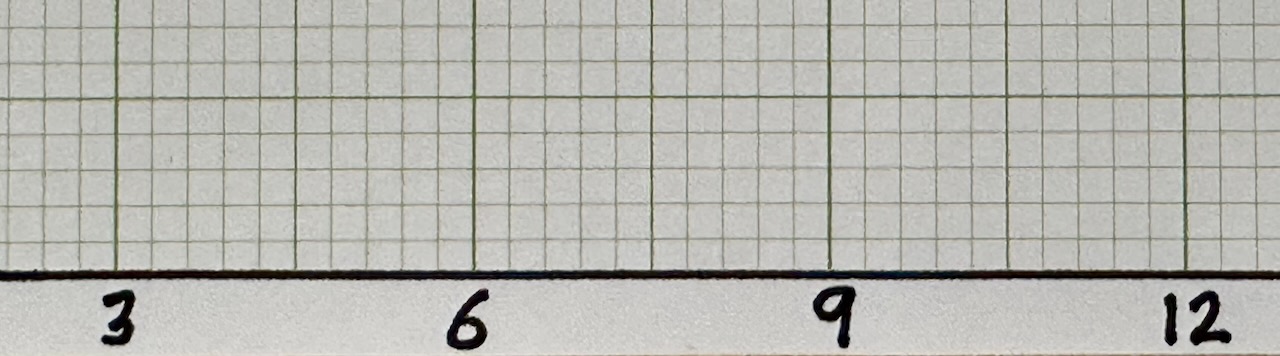
- Scale ratios of 1, 2, 5, 10 or their multiples should be used.
- Odd scales should NOT be used. e.g. Scale ratios of 3, 7, 11, 13 or their multiples must not be used.
- It is not necessary to write down a scale legend for both axes.
-
-
(d) Raw Data Points
-
-
-
- All data points should be indicated by a cross “x” on the graph.
- The size of the cross should be the size of the smallest square on your graph paper.
- DO NOT use dots or blobs to plot the points because they may not be visible after a line/curve is drawn over them.
- For straight line graph plotting, you need at least 6 data points.
- For curve line graph plotting, you need at least 10 data points.
-
-
(e) Drawing the best-fit Line or Curve
-
-
-
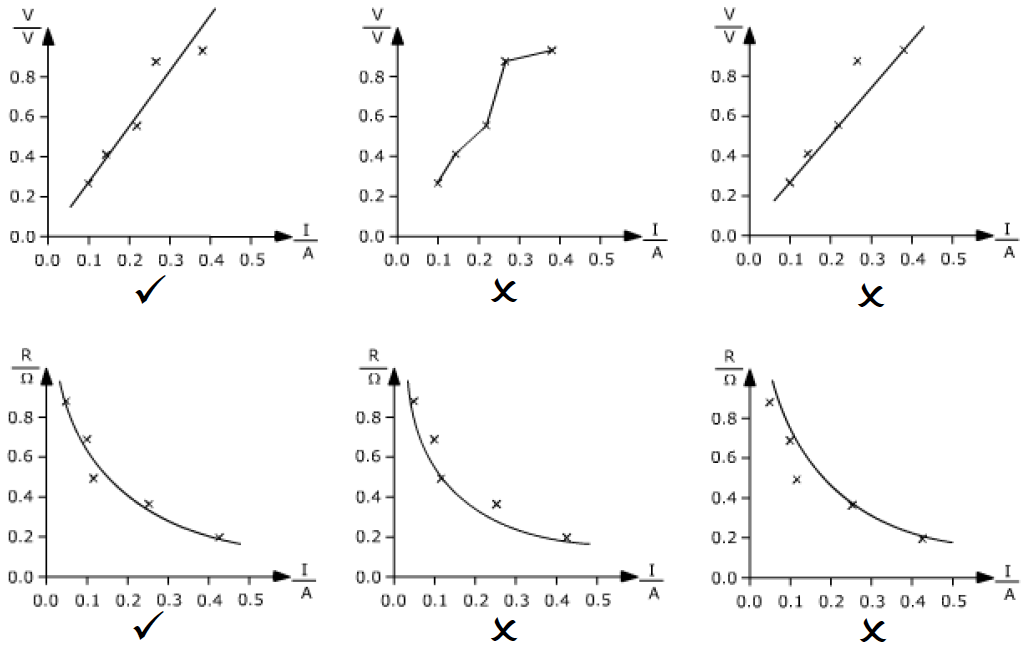
- The graph to be drawn may either be a straight line or a smooth curve.
- How do I know whether the graph is a straight line or a curve?
- Your knowledge of Physics concepts and Mathematics may help you determine the shape of the graph.
- The question may inform you of the shape of the graph.
- If the question asks for the gradient of the graph, then it is likely to be a straight line.
- In most graphs, data points do not fall exactly in a straight line or form a smooth curve. In this case, draw a best-fit line or a best-fit curve.
-
-
-
-
-
- Do not force a graph directly through the origin (even if the theory says so). The line of best fit should be based on the plotted points!
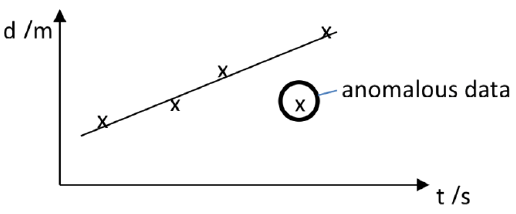
- If there is an anomalous point and there is no time to repeat the experiment, circle and label it as anomalous data as shown below. Failure to do so will result in an erroneous line of best fit.
-
-
| Caution: Don’t be too keen to find anomalous points |
|---|
| I will almost never expect to get an anomalous point during an experiment. If you do find one it usually means that you took the reading incorrectly and can be fixed by repeating that reading.
Also, just circling a random point is not considered to be identifying an anomalous data point. You are expected to clearly state in words “anomalous reading“. |
| Best-fit line practice |
Obtaining Information From a Graph
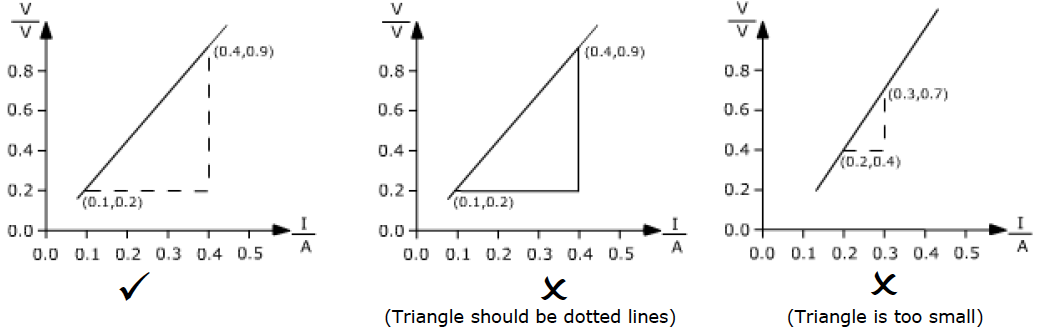
- Find the gradient of a Straight Line
-
- Firstly, draw a right-angle triangle using dotted lines from any two chosen points on the straight line, preferably on the grid.
- The two points do not have to be plotted data points. They can be anywhere on the straight line.
- Make sure that the triangle covers at least 50% of your plotted graph. The bigger the triangle, the more accurate the gradient.
- The coordinates of two chosen points must be written at the point of contact of the triangle and the straight lines.
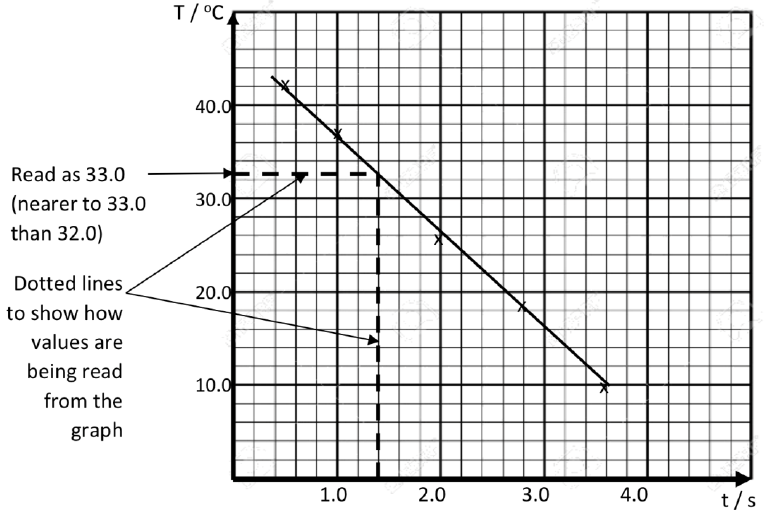
- Reading Values from the Graph
-
- Draw dashed lines to show how a corresponding value is obtained from the graph.
E.g. what is the temperature at t = 1.4 s?
Interpreting A Graph
-
- The conclusion of an experiment often involves stating the relationship between two physical quantities used to plot a graph.
- Common relationships between two variables x and y are shown below:
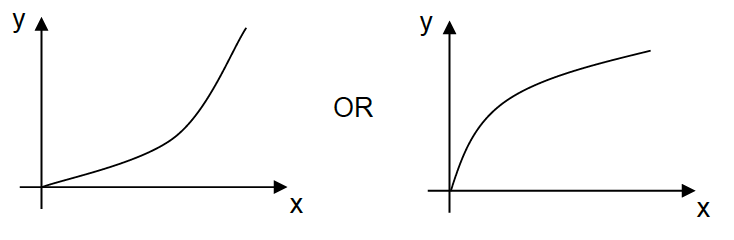
(a) y increases as x increases
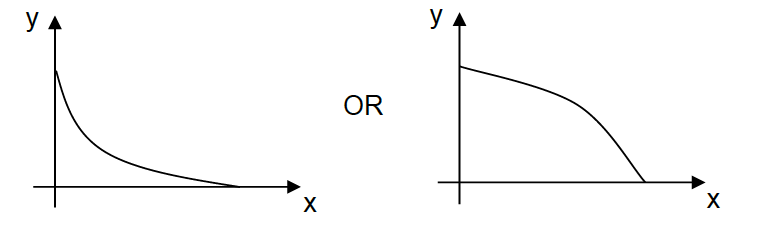
(b) y decreases as x increases
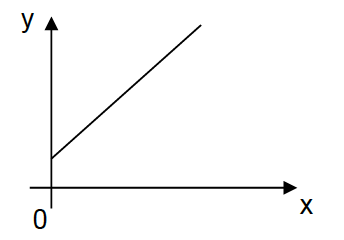
(c) y increases linearly as x increases
(d) y is directly proportional to x
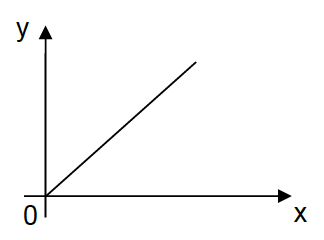
The straight passes through (or very close) to zero.
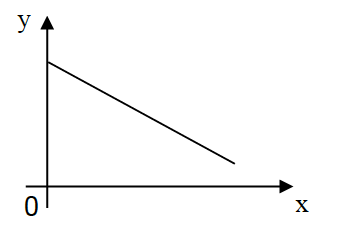
(e) y decreases linearly as x increases
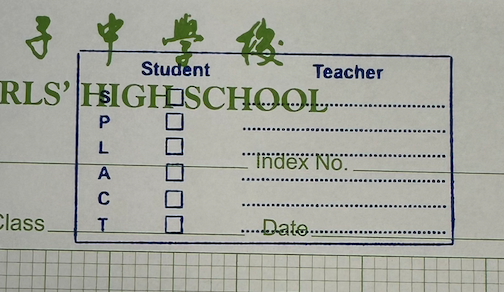
SPLACT
This will help you recall that you need to check the following:
(S)cale
(P)oints plotted correclty
(L)ine (best fit) is drawn
(A)xes are clearly labelled
and if a gradient is required:
(C)oodinates of two points are clearly stated (on the graph paper)
(T)riangle is drawn
To help you this is stamped onto all of your graph paper in the lab.
| Example |
|---|
| What is wrong with the following?
a)
b)
c)
d) |
| Basics |
| Links |
|---|
| Link to Old Version of Mr Shone’s Graph Notes (keynote version) |
| Checking best-fit line and gradient with Microsoft Excel. |
| Best-Fit Line with Casio FX-96SG PLUS Calculator |