Just as a well-written recipe will enable anyone following to create a great dish, a well-written practical procedure should allow anyone following it (even if they have very little physics knowledge) to perform your physics experiment and obtain results.
The experimental procedure should be a detailed, logical sequence of steps that need to be carried out in order to perform the practical.
Points should be numbered clearly.
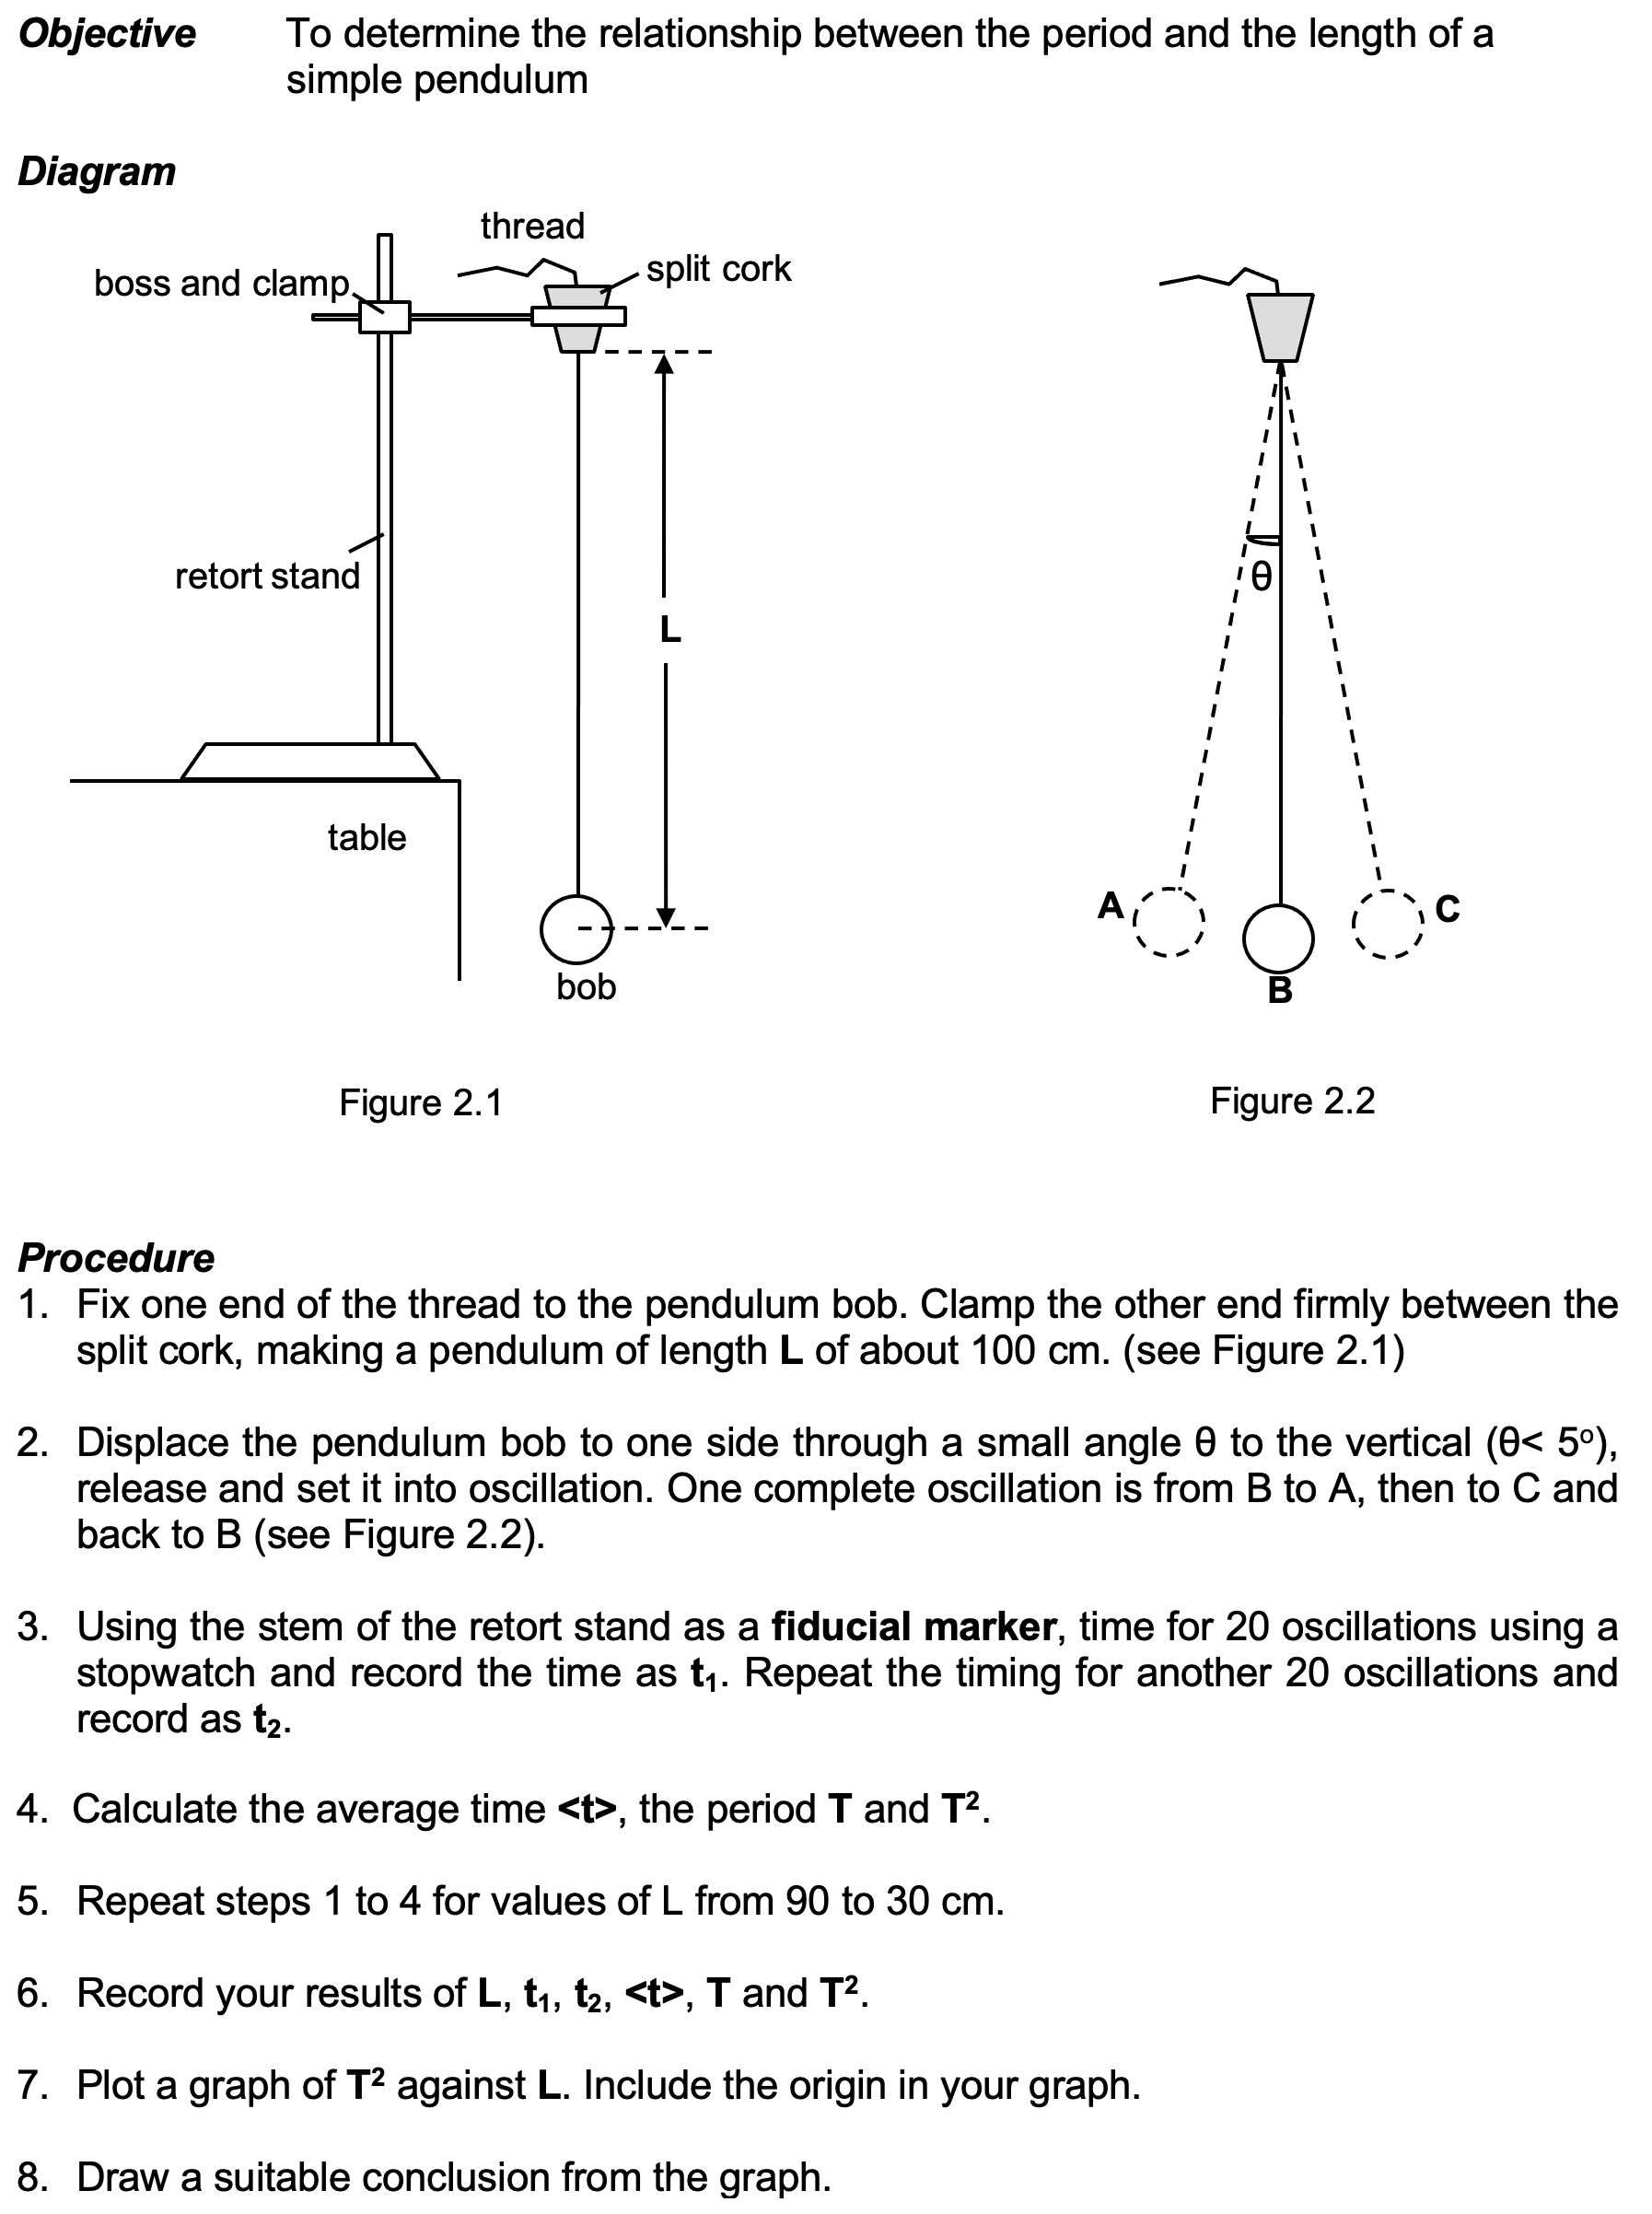
1. Set up the apparatus as shown in the diagram
- All measurements must name the measuring instrument used:
-
-
- Measure the length of string, L, with a metre ruler
- Record the time taken for the pendulum to make 20 complete oscillations, t, with a stop watch.
| Section of the Plan |
Sample |
|
|
- Set up the apparatus as shown in the diagram above.
|
- Measure the independent variable or select the object with required variable (e.g. mass, height, angle, resistance).
|
- Measure the length of the pendulum, L, to obtain 100.0 cm with a metre rule.
|
- Describe the step(s) of experiment to measure the dependent variable (directly or indirectly).
|
- Displace the pendulum bob and allow it to oscillate vertically through a small angle.
- Measure the time taken for 20 oscillations with a stopwatch. Record the time, t1.
|
- Repeat step(s) so as to obtain more reliable readings (where relevant) and calculate the average value.
- Include important/relevant formulae and/or equations used to calculate the dependent variable.
|
- Repeat steps 3 and 4 to measure the time taken for another 20 oscillations. Record the time, t2.
- Calculate the average time, tave from the two readings.
- Calculate the period of the pendulum, T from the equation T = tave / 20 and the value of T2.
|
- Repeat the steps for further measurements (at least another 9 sets of readings) over a suitable wide range (if known).
|
- Repeat steps 2 to 7 for another 9 values of L between 10.0 cm and 90.0 cm.
|
- Tabulate all measured (raw data) and calculated (processed data) values.
|
- Tabulate all the readings of L, t1 , t2 , tave , T and T2.
|
- Plot a graph of dependent variable (usually on the y-axis) against independent variable (usually on the x-axis).
- Based on earlier analysis of given equation
|
- Plot a graph of T2 against L straight line graph is expected to be obtained & g can be deduced from the gradient.
|
Examples of some practicals you may see in Sec 3 & Sec 4:
Pendulum: RollingMarble:
 Reflection:
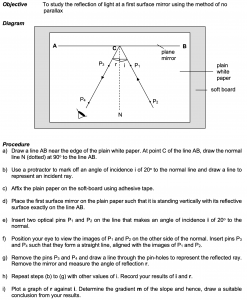
 RollingMarble:
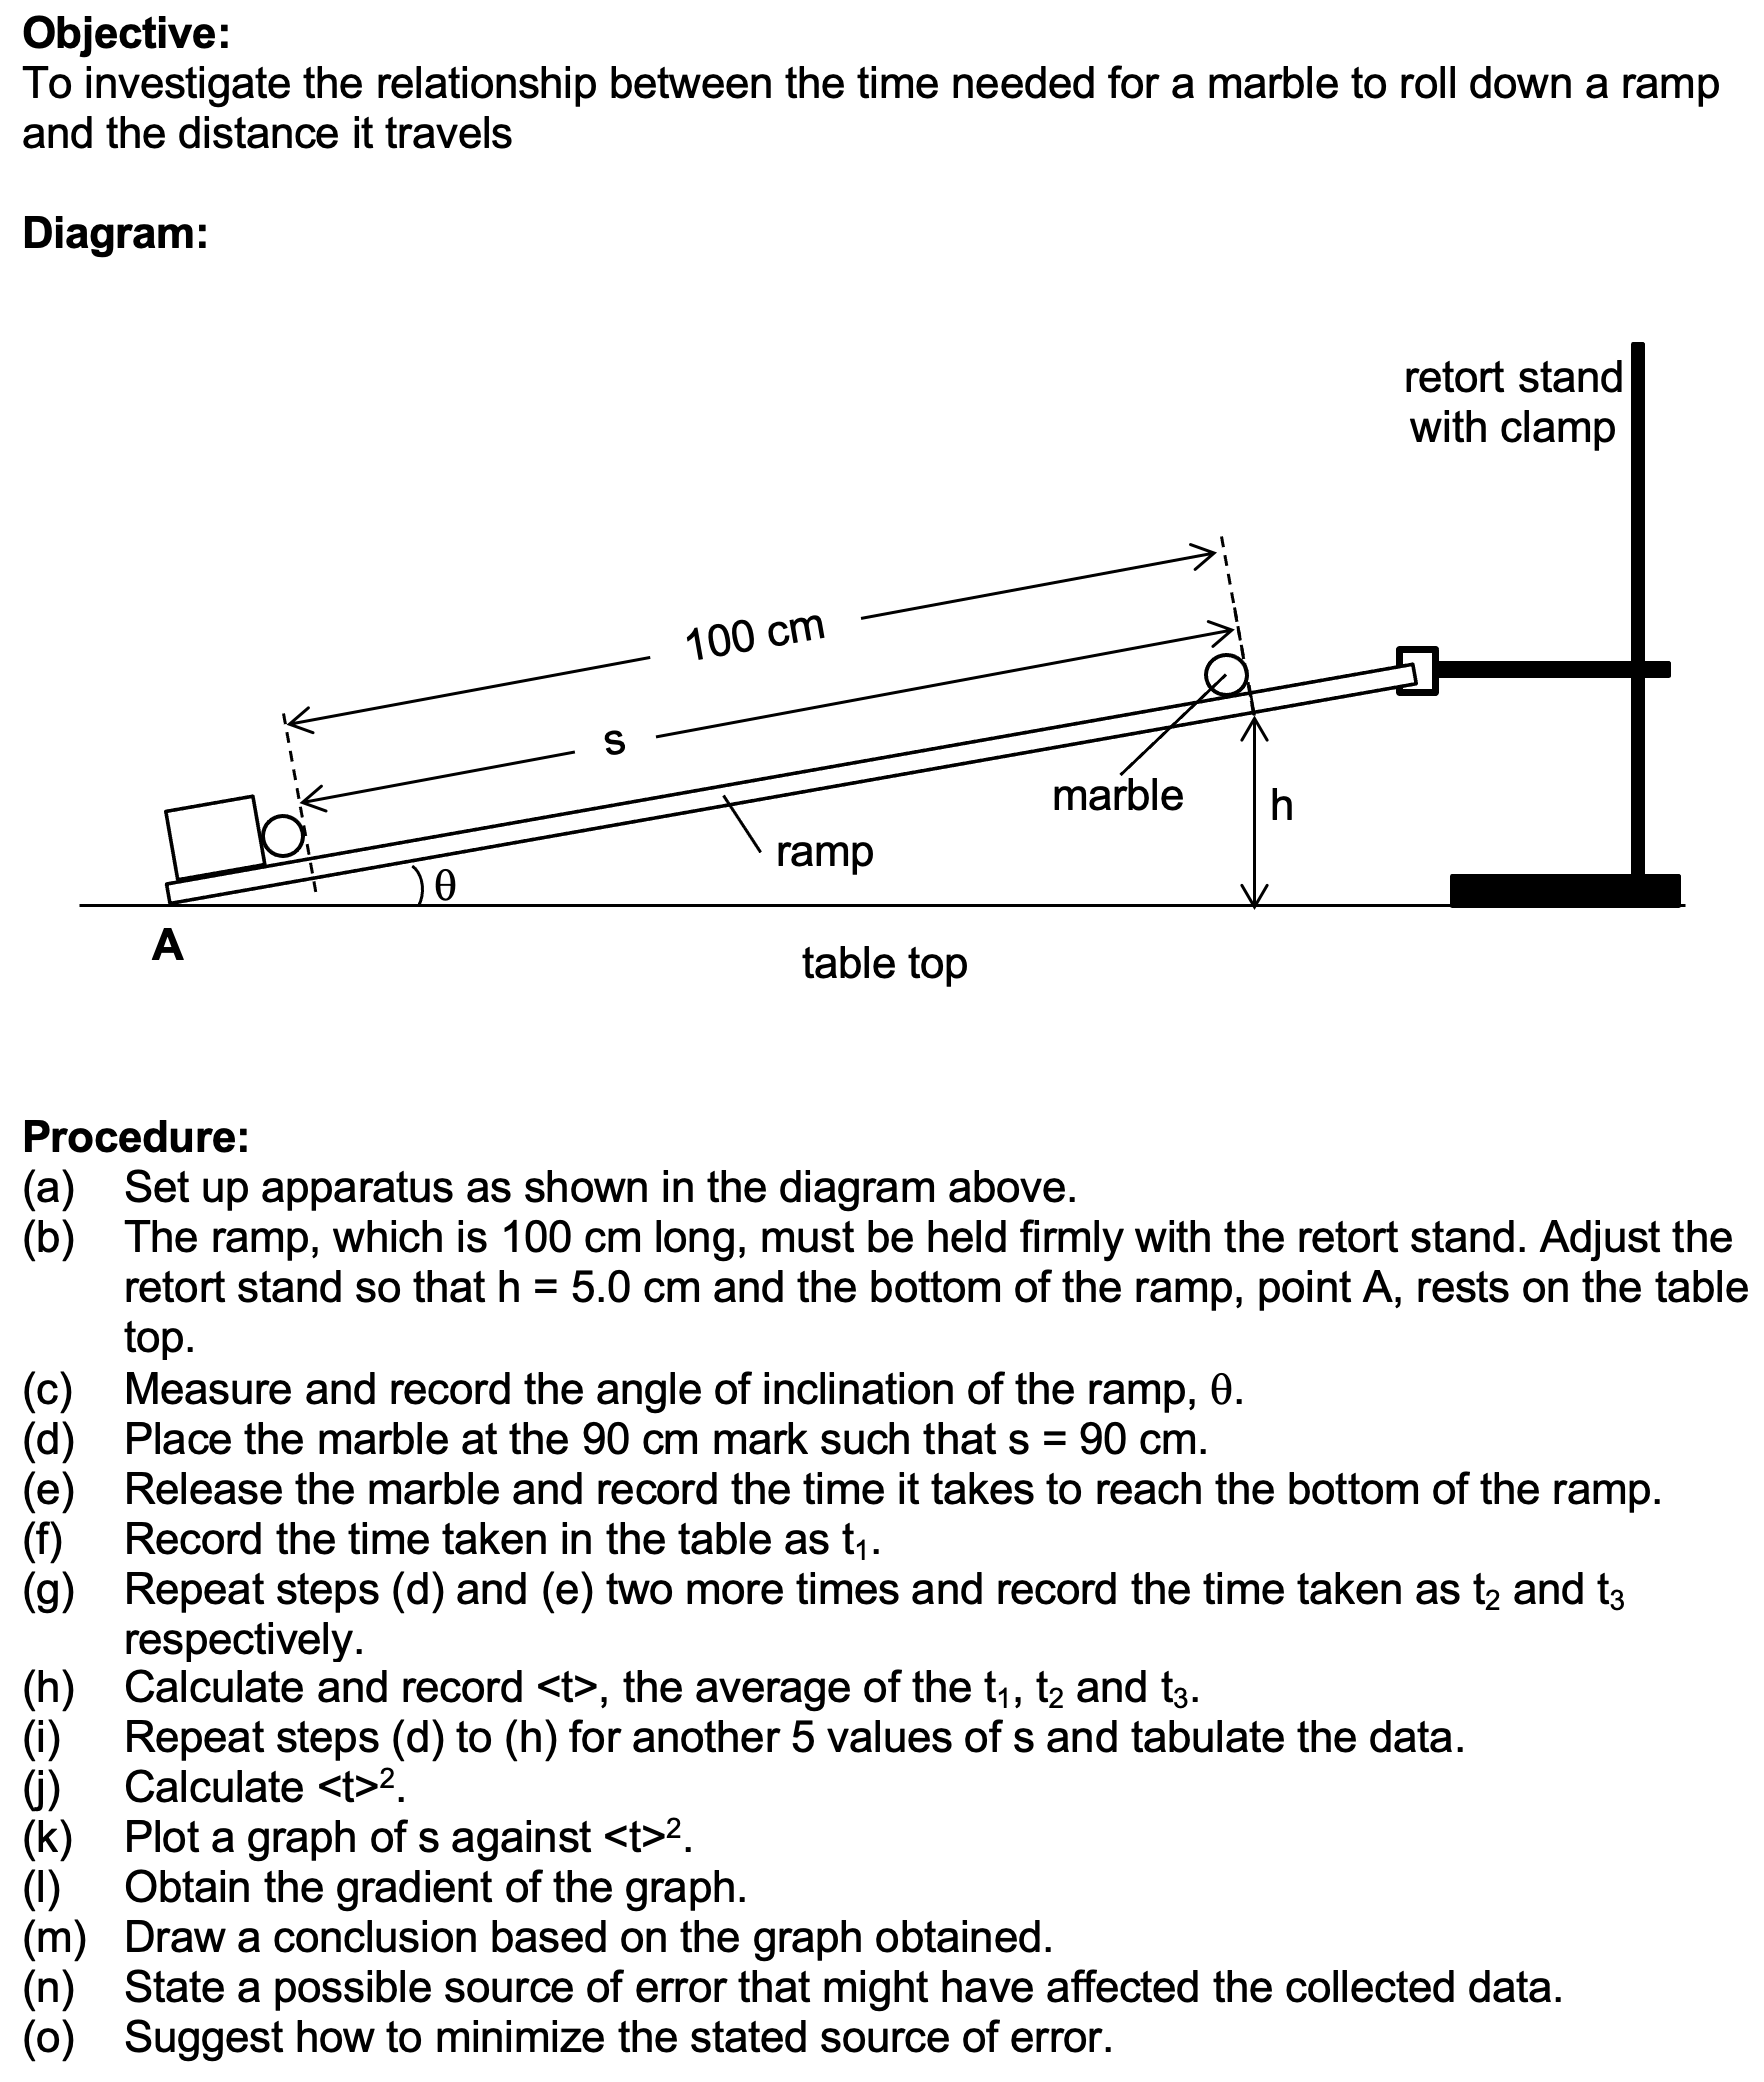 Reflection: